. 2007 Nov 15;93(10):3575-82.
doi: 10.1529/biophysj.107.109884. Epub 2007 Aug 10.

Fluctuations of transfer RNAs between classical and hybrid states

Affiliations

Fluctuations of transfer RNAs between classical and hybrid states

Harold D Kim et al. Biophys J. .

Abstract

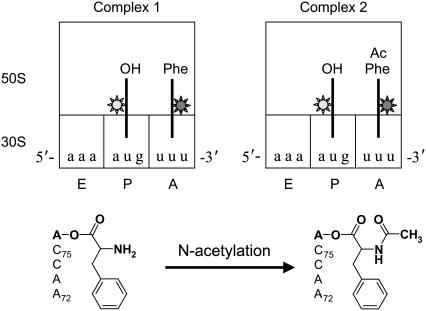
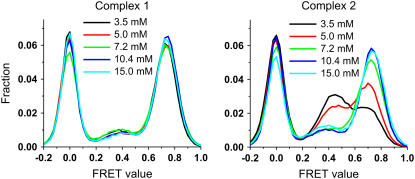
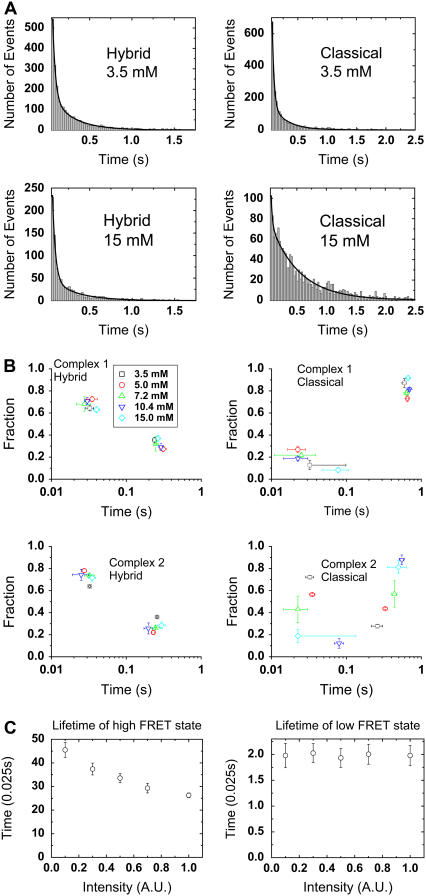
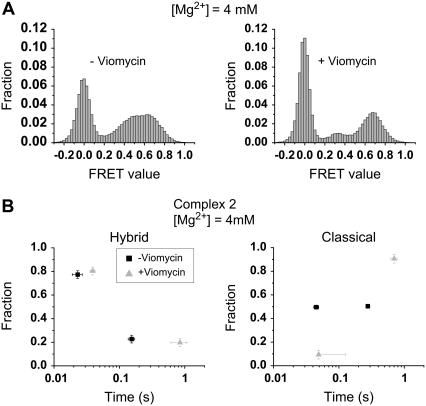
Adjacent transfer RNAs (tRNAs) in the A- and P-sites of the ribosome are in dynamic equilibrium between two different conformations called classical and hybrid states before translocation. Here, we have used single-molecule fluorescence resonance energy transfer to study the effect of Mg(2+) on tRNA dynamics with and without an acetyl group on the A-site tRNA. When the A-site tRNA is not acetylated, tRNA dynamics do not depend on [Mg(2+)], indicating that the relative positions of the substrates for peptide-bond formation are not affected by Mg(2+). In sharp contrast, when the A-site tRNA is acetylated, Mg(2+) lengthens the lifetime of the classical state but does not change the lifetime of the hybrid state. Based on these findings, the classical state resembles a state with direct stabilization of tertiary structure by Mg(2+) ions whereas the hybrid state resembles a state with little Mg(2+)-assisted stabilization. The antibiotic viomycin, a translocation inhibitor, suppresses tRNA dynamics, suggesting that the enhanced fluctuations of tRNAs after peptide-bond formation drive spontaneous attempts at translocation by the ribosome.


Figures

FIGURE 1
FIGURE 1
Monitoring the FRET signal between A- and P-site tRNAs from two different kinds of ribosome complexes. The complex with Phe-tRNAPhe in the A-site is termed complex 1 and the one with AcPhe-tRNAPhe is termed complex 2. Both complexes have a deacylated-tRNAfMet in the P-site. FRET occurs from the Cy3 (light gray) on the P-site tRNA elbow to the Cy5 (dark gray) on the A-site tRNA elbow. The three binding sites are defined only for the 30 S small subunit. Thus, in our experiments, tRNAfMet is always in the P-site, and tRNAPhe is always in the A-site. The chemical modification of the α-amino group by acetylation is shown together with the 3′-end of the tRNA aminoacylated with phenylalanine.
FIGURE 2
FIGURE 2
Probing the fluorescence state of Cy5 in 0-FRET events. (A) A typical time trajectory of Cy3 (light gray) and Cy5 (dark gray) fluorescence signals is shown (from complex 1). Lasers of 532 nm and 635 nm are switched on at all times, the former one to excite Cy3 for a FRET signal and the latter one to probe the fluorescence state of Cy5. The dotted horizontal line indicates the expected level of fluorescence signal when Cy5 is fluorescently active. The solid horizontal line indicates the background level when Cy5 is in the dark state or fluorescently inactive. The Cy5 signal during 0-FRET events indicated by the black arrows lies on the solid line below the dotted line, which directly proves that the 0-FRET events are caused by Cy5 blinking and not by tRNA dynamics. The dark events of Cy5 spanned by Δt1 and Δt2 represent reversible photobleaching events, but not photooxidation events, followed by photorecovery by the 532 nm excitation. (B) The fluorescence state of Cy3 affects the photorecovery rate of Cy5. Δt1 represents dwell times in the fluorescently inactive state of Cy5 while Cy3 is fluorescent, and Δt2 while Cy3 is not fluorescent. Dwell time histograms for Δt1 and Δt2 are shown. They are well fit to single exponential decays with lifetimes of 0.28 s and 6.1 s, respectively. The photorecovery rate is the inverse of the decay time. This rate is ∼24-fold faster when the Cy3-FRET pair is fluorescently active.
FIGURE 3
FIGURE 3
FRET value distribution as a function of Mg2+ concentration. Histograms of FRET values from complex 1 (left) and complex 2 (right) are obtained over five different Mg2+ concentrations (3.5, 5, 7.2, 10.4, 15 mM). Each FRET value is obtained with 25-ms integration time. The height or the frequency of occurrences of each histogram is normalized by the total number of data points.
FIGURE 4
FIGURE 4
Lifetime analysis of classical and hybrid states for complex 1 and complex 2. (A) Dwell time histograms for the classical and hybrid states of complex 2 are shown at two different [Mg2+], 3.5 mM and 15 mM. All histograms are fitted with a double exponential function, A1 × exp (−t/τ1) + A2 × exp (−t/τ2), and fitted curves are shown in black. The decay profile of the hybrid state is similar between the two [Mg2+]s, whereas the average lifetime of the classical state becomes significantly longer at [Mg2+] = 15 mM. (B) Apparent kinetics of the classical and hybrid states at five different [Mg2+]s is shown as two-dimensional scatter plots. All dwell-time histograms have two decay components, and each decay component is summarized by its lifetime along the x axis and its fractional frequency of occurrence along the y axis. The lifetimes (τ1, τ2) and fractional frequencies of occurrence (F1, F2) were obtained from the fitting parameters as explained in the main text. The error bars represent standard errors for the fitting parameters, which are computed from the variation of the fitting parameters across five different bootstrap data sets. [Mg2+] is specified by the same color scheme as in Fig. 3. (C) Monte Carlo simulation of apparent lifetimes as a result of Cy5 photophysics. Blinking and recovery rates of Cy5 were experimentally determined as a function of laser intensity. The intensity used throughout our experiments is defined to be 1. The unit of time is 0.025 s, which is our integration time. As an example, when the real lifetimes of the classical and hybrid states are taken to be 1.0 s and 0.05 s, the apparent lifetimes will be 0.6 s and 0.05 s at intensity = 1 according to this simulation. Therefore, the lifetimes we extracted, especially the ones for slow decay components, are likely to be shorter than the real values.
FIGURE 5
FIGURE 5
Effect of viomycin on the observed tRNA dynamics. (A) FRET value distributions, before (left) and after (right) the addition of 100 μM viomycin (bar graph), are compared at [Mg2+] = 4 mM. In the presence of viomycin, the FRET signal fluctuations are significantly reduced, which is reflected in better separated peaks in the FRET value distribution. (B) Lifetimes of hybrid (left) and classical (right) states are shown before (black square) and after (gray triangle) the addition of viomycin. The two-dimensional scatter plots are generated in the same fashion as in Fig. 4 B. Viomycin lengthens the longer lifetimes of the classical and hybrid state and reduces the fraction of the fast decaying component of the classical state.

References

    1. Semenkov, Y. P., M. V. Rodnina, and W. Wintermeyer. 2000. Energetic contribution of tRNA hybrid state formation to translocation catalysis on the ribosome. Nat. Struct. Biol. 7:1027–1031. - PubMed
    1. Studer, S. M., J. S. Feinberg, and S. Joseph. 2003. Rapid kinetic analysis of EF-G-dependent mRNA translocation in the ribosome. J. Mol. Biol. 327:369–381. - PubMed
    1. Fredrick, K., and H. F. Noller. 2002. Accurate translocation of mRNA by the ribosome requires a peptidyl group or its analog on the tRNA moving into the 30S P site. Mol. Cell. 9:1125–1131. - PubMed
    1. Moazed, D., and H. F. Noller. 1989. Interaction of transfer-RNA with 23s ribosomal-RNA in the ribosomal A-sites, P-sites, and E-sites. Cell. 57:585–597. - PubMed
    1. Moazed, D., and H. F. Noller. 1989. Intermediate states in the movement of transfer-RNA in the ribosome. Nature. 342:142–148. - PubMed

LinkOut - more resources