. 2007 Aug;19(8):2370-90.
doi: 10.1105/tpc.107.052811. Epub 2007 Aug 10.

A molecular timetable for apical bud formation and dormancy induction in poplar

Affiliations

A molecular timetable for apical bud formation and dormancy induction in poplar

Tom Ruttink et al. Plant Cell. 2007 Aug.

Abstract

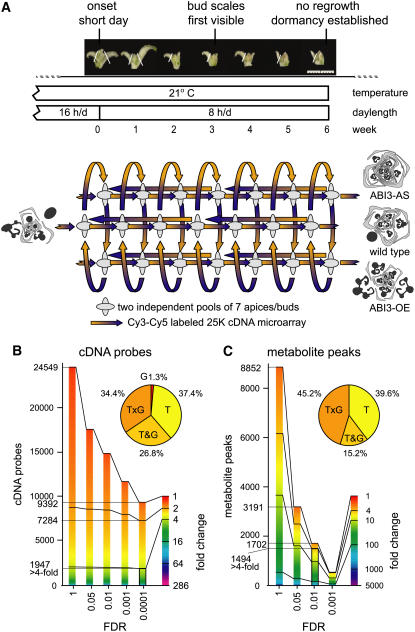
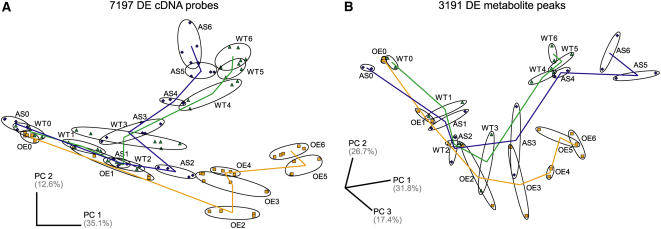
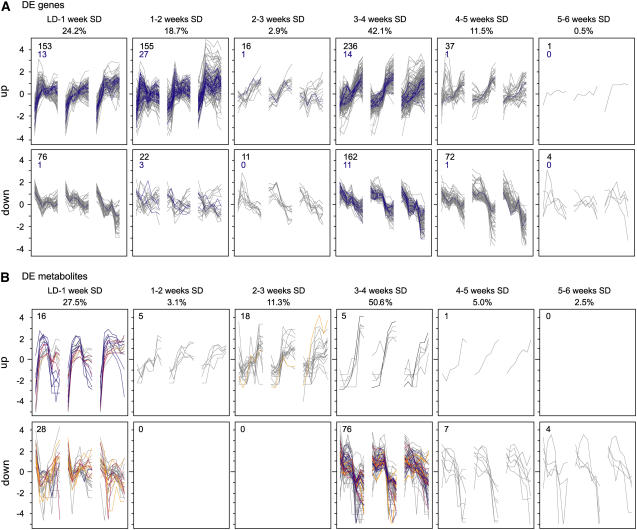
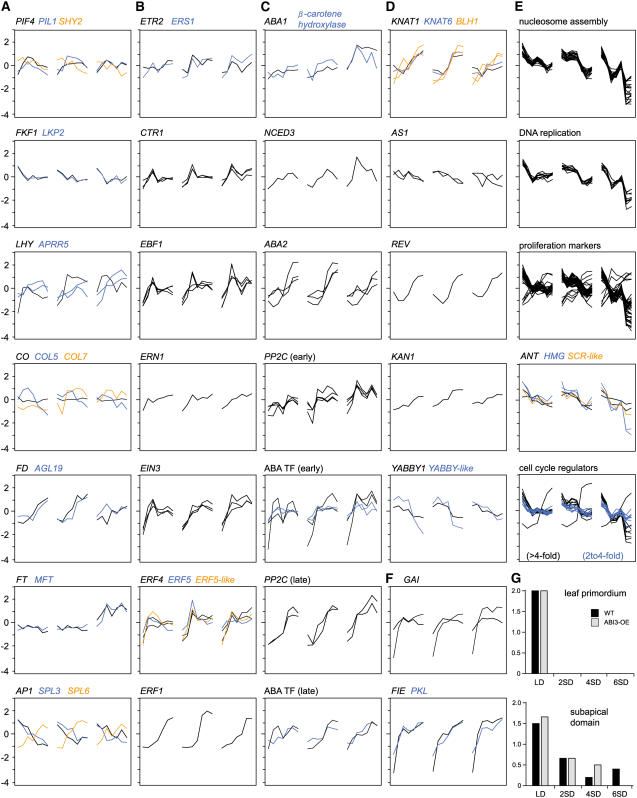
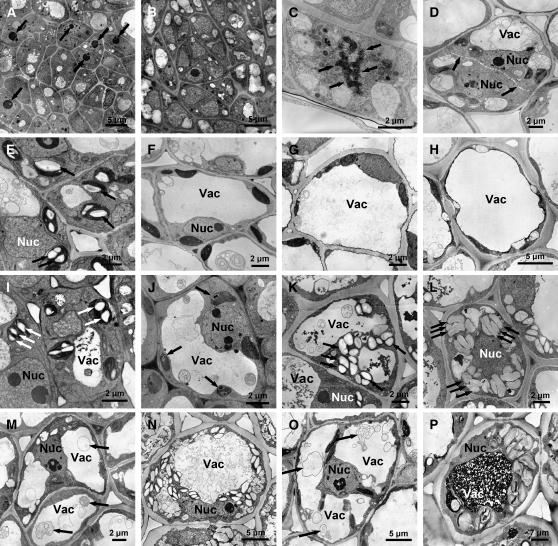
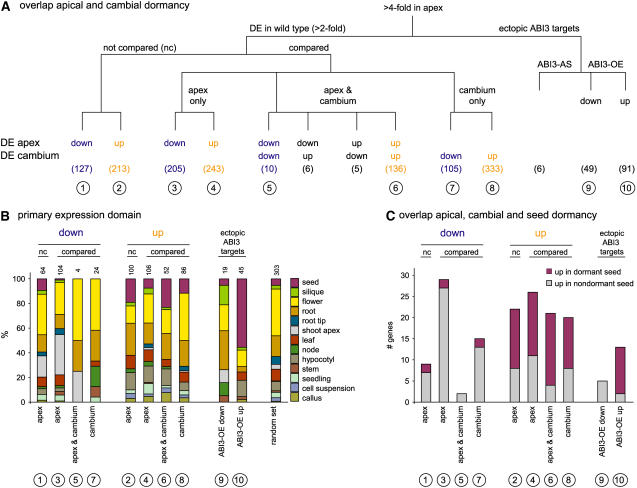
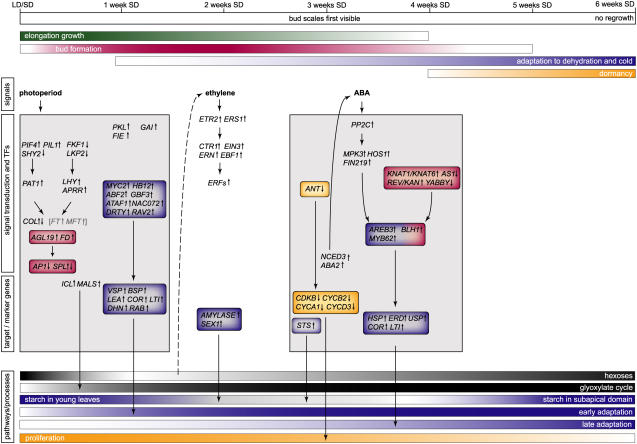
The growth of perennial plants in the temperate zone alternates with periods of dormancy that are typically initiated during bud development in autumn. In a systems biology approach to unravel the underlying molecular program of apical bud development in poplar (Populus tremula x Populus alba), combined transcript and metabolite profiling were applied to a high-resolution time course from short-day induction to complete dormancy. Metabolite and gene expression dynamics were used to reconstruct the temporal sequence of events during bud development. Importantly, bud development could be dissected into bud formation, acclimation to dehydration and cold, and dormancy. To each of these processes, specific sets of regulatory and marker genes and metabolites are associated and provide a reference frame for future functional studies. Light, ethylene, and abscisic acid signal transduction pathways consecutively control bud development by setting, modifying, or terminating these processes. Ethylene signal transduction is positioned temporally between light and abscisic acid signals and is putatively activated by transiently low hexose pools. The timing and place of cell proliferation arrest (related to dormancy) and of the accumulation of storage compounds (related to acclimation processes) were established within the bud by electron microscopy. Finally, the identification of a large set of genes commonly expressed during the growth-to-dormancy transitions in poplar apical buds, cambium, or Arabidopsis thaliana seeds suggests parallels in the underlying molecular mechanisms in different plant organs.


Figures

Figure 1.
Figure 1.
DE Genes and Metabolites during SD Induction of Bud Formation and Dormancy. (A) Apical bud formation and dormancy induced in wild-type (P. tremula × P. alba) poplar and two transgenic lines with antisense downregulation or overexpression of ABI3 (ABI3-AS and ABI3-OE, respectively) during 6 weeks of SD treatment. Photoperiod and temperature regime, bud phenology stages, and sampling points are indicated on the time axis. Apices and buds were sampled at weekly intervals (LDs up to 6 weeks of SDs). The sampled material is depicted; white lines indicate positions where leaves were removed from the sample. At each sampling point, two independent pools of seven apices or buds (depicted by ellipses) were used for combined transcript and GC-MS metabolite profiling. An interconnected, fully balanced loop design consisted of 42 two-color microarrays (time on the horizontal axis, genotype on the vertical axis) and six extra microarrays comparing more distantly related samples within the time series. Schematic drawings of transversal sections of apices or buds show identical organ composition under LDs and contrasting bud morphology after SD treatment (black, embryonic leaves; gray, bud scales/stipules) (Rohde et al., 2002). Bar = 1 cm. (B) and (C) Fractions of the sampled transcriptome (B) or metabolome (C) considered as DE in function of fold change and FDR. The fold change is depicted in false color, and cDNA probes or metabolite peaks are ordered by magnitude of fold change. Distribution of time (T), genotype (G), time and genotype (T&G), and time–genotype interaction (T×G) effects are given for 1947 DE cDNA probes (more than fourfold, FDR < 0.0001) and for 1494 DE metabolite peaks (more than fourfold, FDR < 0.01).
Figure 2.
Figure 2.
Global Changes in Transcript and Metabolite Composition during SD-Induced Apical Bud Development. (A) PCA plot of the transcriptome composition of 96 individually hybridized samples, represented each by the combined expression data of 7197 of all 9392 significantly DE cDNA probes (FDR < 0.0001) with expression data in all hybridizations. Ellipses group replicate hybridizations of all samples for a genotype at a given time, including the two independent biological replicates. (B) PCA plot of metabolite composition of 42 individual samples, represented by the combined expression data of 3191 significantly DE metabolite peaks (FDR < 0.05). Ellipses group the two independent biological replicates for a genotype at a given time. Samples are labeled starting from LD (0) throughout 6 weeks SD treatment (1 to 6). ABI3-AS, blue diamonds; wild type, green triangles; ABI3-OE, orange squares. Percentage of variance explained is given for the respective principal component (PC) axes.
Figure 3.
Figure 3.
Temporal Categorization of Changes in Gene Expression and Metabolite Levels during Bud Development. A total of 945 genes (A) and 160 compounds (B) of the respective fourfold set (with more than twofold change in expression in the wild type) were grouped by directionality and time interval of maximal change in expression in the wild type. Profiles are given as log2-transformed, mean-centered data. The top row indicates the time intervals and the percentage of this group within the respective fourfold set. In each graph, wild-type profiles are flanked by ABI3-AS (left) and ABI3-OE (right), with each consisting of seven sampling points. (A) Within gene expression clusters, DE TFs are highlighted in blue. Numbers in the top left corner of each panel denote the total number of genes (black) and the number of TFs (blue) belonging to the cluster. (B) Numbers in the top left corner of each panel denote the total number of compounds belonging to the cluster. Gray, unknown compounds; orange, sugars or sugar alcohols; blue, amino acids; red, organic acids; black, catechine.
Figure 4.
Figure 4.
Activation of Signaling and Developmental Pathways during SD-Induced Apical Bud Development. (A) Light signaling, circadian clock, and CO/FT regulon. (B) Ethylene signaling. (C) ABA biosynthesis, signaling, and ABA-regulated TF. (D) Meristem identity, meristem activity, organ development, and leaf patterning. (E) Cell proliferation. (F) Early SD-upregulated genes. (G) Estimates of the frequency of mitotic figures in leaf primordium and the subapical domain during bud development in the wild type (black) and ABI3-OE (gray), given according to the frequency of occurrence of mitotic figures, with 0 (none), 1 (rare), or 2 (at least 2 to 4; frequent), observed in hundreds of cells in a transmission electron microscopic section. Obtained scores were averaged over three to five sections per sampling point and genotype. Typical mitotic figures are shown in Figures 5C and 5D. In each graph, wild-type gene expression profiles are flanked by ABI3-AS (left) and ABI3-OE (right), with each consisting of seven sampling points. Expression profiles are given as log2-transformed, mean-centered data. For regulatory genes, more than twofold DE genes are shown; for genes encoding structural components, more than fourfold DE genes are shown. For full gene names, see text.
Figure 5.
Figure 5.
Cellular Aspects of Bud Development in the Wild Type and ABI3-OE. (A) Part of the apical meristem in the wild type under LD conditions. Arrows point to large nucleoli in meristematic cells. (B) Part of the apical meristem in the wild type after 6 weeks of SDs. Most nuclei in meristematic cells lack visible nucleoli. (C) Typical mitotic figure, cell in metaphase of cell division with separating chromosomes (arrows). (D) Typical mitotic figure, cell in late telophase of cell division with a developing cell plate (arrows). (E) to (H) Starch accumulation in wild-type leaf cells in LDs and after 2, 4, and 6 weeks of SDs. Starch granules are absent after 2, 4, and 6 weeks of SDs. Arrows in (E) point to starch granules. (I) to (L) Starch accumulation in ABI3-OE leaf cells in LDs and after 2, 4, and 6 weeks of SDs. Starch gradually accumulates after 2 weeks of SDs. Arrows point to starch granules. (M) and (N) Starch accumulation and vacuoles in wild-type cells of the subapical domain in LDs and after 6 weeks of SDs. Arrows in (M) point to vesicular material in lytic vacuoles. (O) and (P) Starch accumulation and vacuoles in ABI3-OE cells of the subapical domain in LDs and after 6 weeks of SDs. Arrows in (O) point to vesicular material in lytic vacuoles. Nuc, nucleus; Vac, vacuole.
Figure 6.
Figure 6.
Metabolic Rearrangements in Glyoxylate/Citric Acid Cycle, Carbohydrate Metabolism, and Starch Biosynthesis and Degradation during Bud Development. (A) Metabolite abundance profiles. (B) Expression profiles of genes encoding enzymes of the glyoxylate cycle. (C) Expression profiles of genes encoding enzymes involved in starch degradation. (D) Expression profiles of genes encoding enzymes involved in sucrose, raffinose, and starch biosynthesis. In each graph, wild-type profiles are flanked by ABI3-AS (left) and ABI3-OE (right), with each consisting of seven sampling points. Gene expression profiles are given as log2-transformed, mean-centered data. Genes encoding enzymes are named by their EC number; for full names, see text. For metabolites, regression curves for peak abundance (selected ion current/100 ng dry weight) are given, together with 95% confidence bands.
Figure 7.
Figure 7.
Expression of Adaptive Response Genes and ABI3-Dependent Genes during Bud Development. (A) Genes associated with responses to ABA, cold, drought, and seed maturation analyzed for expression during bud development. For each of the four responses, the total number of genes on the microarray is given, and the Venn diagram indicates the number of genes shared with one or more of the other groups for more than twofold (black) and more than fourfold (orange) DE gene sets. Genes shared between ABA response and seed maturation (AS) and cold and drought responses (CD) are given separately. The fourfold DE genes of the four groups are clustered according to the time of maximal upregulation or downregulation, occurring early (before 3 weeks of SDs) or late (after 3 weeks of SDs). (B) and (C) Ectopic and putative ABI3 targets identified among the fourfold DE genes. The 146 ectopic targets (B) are characterized by ABI3-dependent expression profiles in the absence of DE in the wild type (less than twofold DE). The 324 putative ABI3 targets (C) have ABI3-dependent expression profiles and more than twofold DE in the wild type. The genes are categorized according to the requirement of SDs for the genotype effect to be recognized (more than twofold DE between the wild type and ABI3-OE in LDs) and according to temporal expression dynamics. Arrows indicate the extent of upregulation or downregulation in different genotypes. Six genes that are upregulated in ABI3-AS after exposure to SDs (B) are not shown. In each graph, wild-type profiles are flanked by ABI3-AS (left) and ABI3-OE (right), with each consisting of seven sampling points. Gene expression profiles are given as log2-transformed, mean-centered data. In all clusters, fourfold DE adaptive response genes are depicted in orange, and TFs are depicted in blue. Other ABI3-dependent genes are depicted in gray. Numbers in the top left corner of each panel correspond to the total number of genes (black), number of adaptive response genes (orange), and number of TFs (blue).
Figure 8.
Figure 8.
Common and Specific Changes in the Transcriptome during the Growth-to-Dormancy Transition in Poplar Apical Buds, Poplar Cambial Meristem, and Arabidopsis Seeds. (A) Overlap of the apical and cambial growth-to-dormancy transition in poplar. Of the 945 genes classified as DE in the apex of the wild type, 340 cannot be compared with cambial expression data because the POP2 microarray is extended with an additional probe set compared with the POP1 microarray used by Schrader et al. (2004). The original cambium cDNA probe data are here given as genes. Gene sets found in only apex, only cambium, or both apex and cambium are delineated. The directionality of expressional change toward dormancy is specified for apex and cambium. Gene sets are numbered (in circles) for correspondence with (B) and (C). (B) Relative distribution of organ-specific expression within gene sets defined in (A). Distributions are based on expression data of the closest Arabidopsis genes, retrieved from Genevestigator. Organ specificity was assumed when an organ contained >10% of the total signal of all 42 different organs represented in Genevestigator. The 42 different organs were subsequently grouped to the 13 major classes represented here. Gene sets from (A) show different organ-specific expression domains and also clearly deviate from those of 1000 random Arabidopsis genes given for reference. Numbers above the bars indicate the total number of genes in each gene set with organ-specific expression; genes without organ-specific expression are omitted. (C) Overlap of the gene sets in (A) with those identified in dormant and nondormant Arabidopsis Cvi seeds (classification according to Cadman et al., 2006). Poplar genes are linked with the closest Arabidopsis homologs to the Arabidopsis expression data.
Figure 9.
Figure 9.
Integrative Molecular Timetable of Bud Development in Poplar. Autumnal bud development is a composite of bud formation (red), acclimation to dehydration and cold (blue), and dormancy (orange). Selected genes or processes that specifically belong to one of these aspects are highlighted accordingly. Simultaneous with bud development, elongation growth (green) gradually ceases in young derivatives that are displaced from the apex. Bud development is characterized by the sequential activation of light, ethylene, and ABA signal transduction pathways. The major transcriptional changes at the regulatory and target process levels are depicted at the time that the respective genes show their maximal change in expression. The two major phases of transcriptional and metabolic response are indicated by gray boxes. Below, tentative levels of cellular responses and/or the quantity of major metabolites are indicated with a graded scale. Arrows connect regulators and TFs to their putative downstream processes, without implying a genetic or direct molecular interaction. Because of its putative nature, the link between low sugar and ethylene signal transduction is shown with a dashed arrow. Genes shown in gray and within brackets are only found DE in ABI3-OE. ICL, ISOCITRATE LYASE; MALS, MALATE SYNTHASE; STS, STARCH SYNTHASE; SEX1, STARCH EXCESS1-GLUCAN/WATER DIKINASE). For a full explanation and other names, see text.

Similar articles

Cited by

References

    1. Arend, M., and Fromm, J. (2003). Ultrastructural changes in cambial cell derivatives during xylem differentiation in poplar. Plant Biol. 5 255–264.
    1. Barrero, J.M., Rodríguez, P.L., Quesada, V., Piqueras, P., Ponce, M.R., and Micol, J.L. (2006). Both abscisic acid (ABA)-dependent and ABA-independent pathways govern the induction of NCED3, AAO3 and ABA1 in response to salt stress. Plant Cell Environ. 29 2000–2008. - PubMed
    1. Baumbusch, L.O., Hughes, D.W., Galau, G.A., and Jakobsen, K.S. (2004). LEC1, FUS3, ABI3 and Em expression reveals no correlation with dormancy in Arabidopsis. J. Exp. Bot. 55 77–87. - PubMed
    1. Beemster, G.T.S., De Veylder, L., Vercruysse, S., West, G., Rombaut, D., Van Hummelen, P., Galichet, A., Gruissem, W., Inzé, D., and Vuylsteke, M. (2005). Genome-wide analysis of gene expression profiles associated with cell cycle transitions in growing organs of Arabidopsis. Plant Physiol. 138 734–743. - PMC - PubMed
    1. Benedict, C., Skinner, J.S., Meng, R., Chang, Y., Bhalerao, R., Huner, N.P.A., Finn, C.E., Chen, T.H.H., and Hurry, V. (2006). The CBF1-dependent low temperature signalling pathway, regulon and increase in freeze tolerance are conserved in Populus spp. Plant Cell Environ. 29 1259–1272. - PubMed

Publication types

MeSH terms

LinkOut - more resources