Allele-specific expression patterns reveal biases and embryo-specific parent-of-origin effects in hybrid maize
- PMID: 17693532
- PMCID: PMC2002603
- DOI: 10.1105/tpc.107.052258
Allele-specific expression patterns reveal biases and embryo-specific parent-of-origin effects in hybrid maize
Abstract
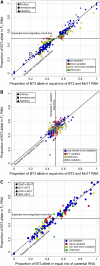
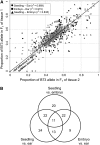
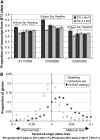
We employed allele-specific expression (ASE) analyses to document biased allelic expression in maize (Zea mays). A set of 316 quantitative ASE assays were used to profile the relative allelic expression in seedling tissue derived from five maize hybrids. The different hybrids included in this study exhibit a range of heterosis levels; however, we did not observe differences in the frequencies of allelic bias. Allelic biases in gene expression were consistently observed for approximately 50% of the genes assayed in hybrid seedlings. The relative proportion of genes that exhibit cis- or trans-acting regulatory variation was very similar among the different genotypes. The cis-acting regulatory variation was more prevalent and resulted in greater expression differences than trans-acting regulatory variation for these genes. The ASE assays were further used to compare the relative expression of the B73 and Mo17 alleles in three tissue types (seedling, immature ear, and embryo) derived from reciprocal hybrids. These comparisons provided evidence for tissue-specific cis-acting variation and for a slight maternal expression bias in approximately 20% of genes in embryo tissue. Collectively, these data provide evidence for prevalent cis-acting regulatory variation that contributes to biased allelic expression between genotypes and between tissues.
Figures


Similar articles
-
Cis-transcriptional variation in maize inbred lines B73 and Mo17 leads to additive expression patterns in the F1 hybrid.Genetics. 2006 Aug;173(4):2199-210. doi: 10.1534/genetics.106.060699. Epub 2006 May 15. Genetics. 2006. PMID: 16702414 Free PMC article.
-
Paternal dominance of trans-eQTL influences gene expression patterns in maize hybrids.Science. 2009 Nov 20;326(5956):1118-20. doi: 10.1126/science.1178294. Science. 2009. PMID: 19965432
-
Asymmetric allele-specific expression in relation to developmental variation and drought stress in barley hybrids.Plant J. 2009 Jul;59(1):14-26. doi: 10.1111/j.1365-313X.2009.03848.x. Epub 2009 Feb 26. Plant J. 2009. PMID: 19309461
-
Allelic variation and heterosis in maize: how do two halves make more than a whole?Genome Res. 2007 Mar;17(3):264-75. doi: 10.1101/gr.5347007. Epub 2007 Jan 25. Genome Res. 2007. PMID: 17255553 Review.
-
Gene expression divergence and the origin of hybrid dysfunctions.Genetica. 2007 Jan;129(1):71-81. doi: 10.1007/s10709-006-0034-1. Epub 2006 Oct 17. Genetica. 2007. PMID: 17043744 Review.
Cited by
-
A Robust Methodology for Assessing Differential Homeolog Contributions to the Transcriptomes of Allopolyploids.Genetics. 2018 Nov;210(3):883-894. doi: 10.1534/genetics.118.301564. Epub 2018 Sep 13. Genetics. 2018. PMID: 30213855 Free PMC article.
-
Landscape of the Noncoding Transcriptome Response of Two Arabidopsis Ecotypes to Phosphate Starvation.Plant Physiol. 2020 Jul;183(3):1058-1072. doi: 10.1104/pp.20.00446. Epub 2020 May 13. Plant Physiol. 2020. PMID: 32404413 Free PMC article.
-
Predominant contribution of cis-regulatory divergence in the evolution of mouse alternative splicing.Mol Syst Biol. 2015 Jul 1;11(7):816. doi: 10.15252/msb.20145970. Mol Syst Biol. 2015. PMID: 26134616 Free PMC article.
-
Genome-wide analysis of NBS-LRR genes revealed contribution of disease resistance from Saccharum spontaneum to modern sugarcane cultivar.Front Plant Sci. 2023 Feb 20;14:1091567. doi: 10.3389/fpls.2023.1091567. eCollection 2023. Front Plant Sci. 2023. PMID: 36890898 Free PMC article.
-
Power calculator for detecting allelic imbalance using hierarchical Bayesian model.BMC Res Notes. 2021 Nov 27;14(1):436. doi: 10.1186/s13104-021-05851-x. BMC Res Notes. 2021. PMID: 34838135 Free PMC article.
References
-
- Adams, K.L. (2007). Evolution of duplicate gene expression in polyploid and hybrid plants. J. Hered. 98 136–141. - PubMed
-
- Benjamini, Y., and Hochberg, Y. (1995). Controlling the false positive discovery rate: A practical and powerful approach to multiple testing. J. R. Stat. Soc. B 57 289–300.
Publication types
MeSH terms
LinkOut - more resources
Full Text Sources

