

A multidimensional analysis of genes mutated in breast and colorectal cancers
- PMID: 17693572
- PMCID: PMC1950899
- DOI: 10.1101/gr.6431107
A multidimensional analysis of genes mutated in breast and colorectal cancers
Abstract
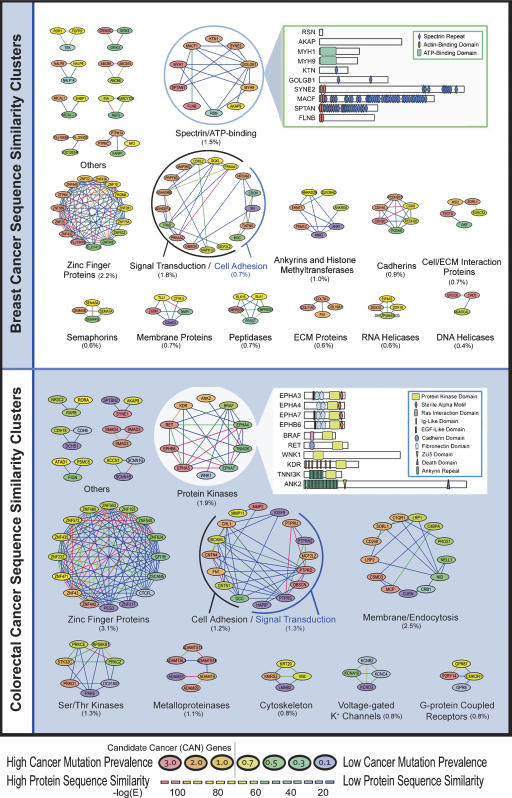
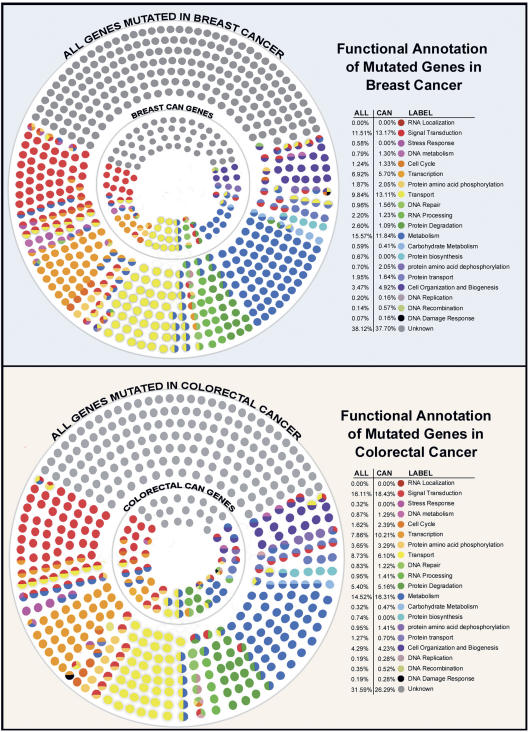
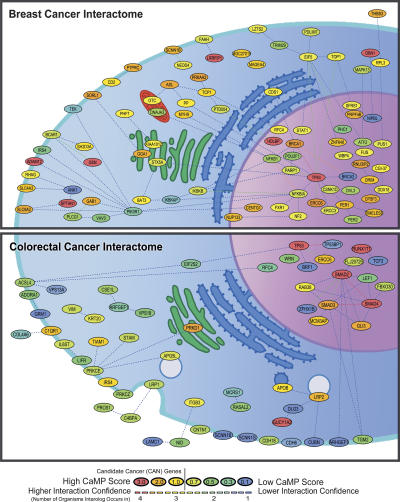
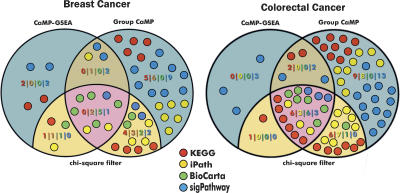
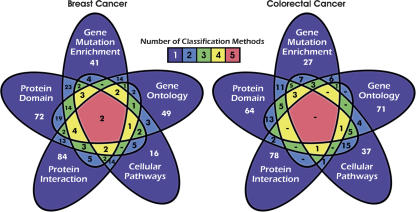
A recent study of a large number of genes in a panel of breast and colorectal cancers identified somatic mutations in 1149 genes. To identify potential biological processes affected by these genes, we examined their putative roles based on sequence similarity, membership in known functional groups and pathways, and predicted interactions with other proteins. These analyses identified functional groups and pathways that were enriched for mutated genes in both tumor types. Additionally, the results pointed to differences in molecular mechanisms that underlie breast and colorectal cancers, including various intracellular signaling and metabolic pathways. These studies provide a multidimensional framework to guide further research and help identify cellular processes critical for malignant progression and therapeutic intervention.
Figures
References
-
- Altschul S.F., Gish W., Miller W., Myers E.W., Lipman D.J., Gish W., Miller W., Myers E.W., Lipman D.J., Miller W., Myers E.W., Lipman D.J., Myers E.W., Lipman D.J., Lipman D.J. Basic local alignment search tool. J. Mol. Biol. 1990;215:403–410. - PubMed
-
- Apweiler R., Attwood T.K., Bairoch A., Bateman A., Birney E., Biswas M., Bucher P., Cerutti L., Corpet F., Croning M.D., Attwood T.K., Bairoch A., Bateman A., Birney E., Biswas M., Bucher P., Cerutti L., Corpet F., Croning M.D., Bairoch A., Bateman A., Birney E., Biswas M., Bucher P., Cerutti L., Corpet F., Croning M.D., Bateman A., Birney E., Biswas M., Bucher P., Cerutti L., Corpet F., Croning M.D., Birney E., Biswas M., Bucher P., Cerutti L., Corpet F., Croning M.D., Biswas M., Bucher P., Cerutti L., Corpet F., Croning M.D., Bucher P., Cerutti L., Corpet F., Croning M.D., Cerutti L., Corpet F., Croning M.D., Corpet F., Croning M.D., Croning M.D., et al. The InterPro database, an integrated documentation resource for protein families, domains and functional sites. Nucleic Acids Res. 2001;29:37–40. - PMC - PubMed
-
- Ashburner M., Ball C.A., Blake J.A., Botstein D., Butler H., Cherry J.M., Davis A.P., Dolinski K., Dwight S.S., Eppig J.T., Ball C.A., Blake J.A., Botstein D., Butler H., Cherry J.M., Davis A.P., Dolinski K., Dwight S.S., Eppig J.T., Blake J.A., Botstein D., Butler H., Cherry J.M., Davis A.P., Dolinski K., Dwight S.S., Eppig J.T., Botstein D., Butler H., Cherry J.M., Davis A.P., Dolinski K., Dwight S.S., Eppig J.T., Butler H., Cherry J.M., Davis A.P., Dolinski K., Dwight S.S., Eppig J.T., Cherry J.M., Davis A.P., Dolinski K., Dwight S.S., Eppig J.T., Davis A.P., Dolinski K., Dwight S.S., Eppig J.T., Dolinski K., Dwight S.S., Eppig J.T., Dwight S.S., Eppig J.T., Eppig J.T., et al. Gene ontology: Tool for the unification of biology. The Gene Ontology Consortium. Nat. Genet. 2000;25:25–29. - PMC - PubMed
-
- Benjamini Y., Hochberg Y., Hochberg Y. Controlling the false discovery rate: A practical and powerful approach to multiple testing. J. R. Stat. Soc. [Ser A] 1995;57:289–300.
Publication types
MeSH terms
Substances
Grants and funding
LinkOut - more resources
Full Text Sources
Other Literature Sources
Medical