. 2007 Sep;117(9):2431-44.
doi: 10.1172/JCI31060.

Ca2+- and mitochondrial-dependent cardiomyocyte necrosis as a primary mediator of heart failure

Affiliations

Ca2+- and mitochondrial-dependent cardiomyocyte necrosis as a primary mediator of heart failure

Hiroyuki Nakayama et al. J Clin Invest. 2007 Sep.

Abstract

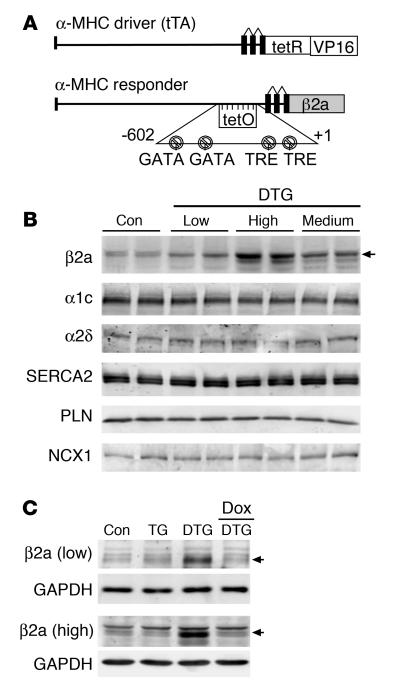
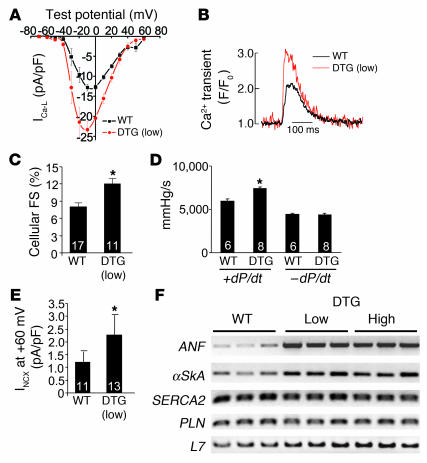
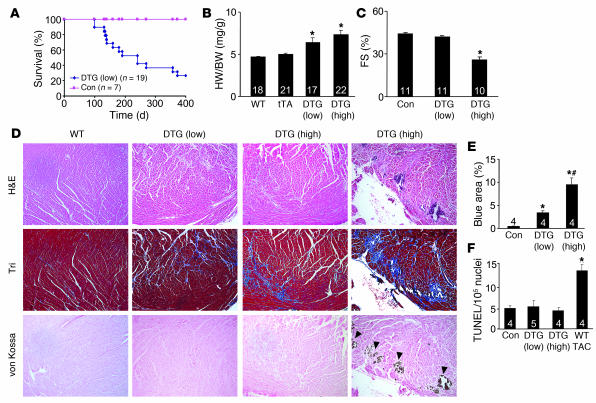
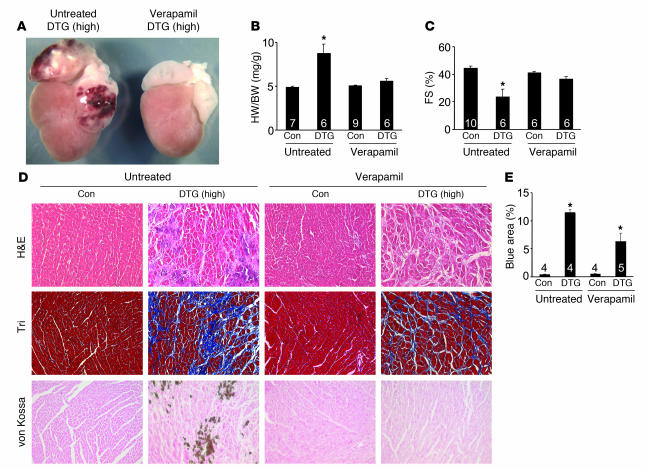
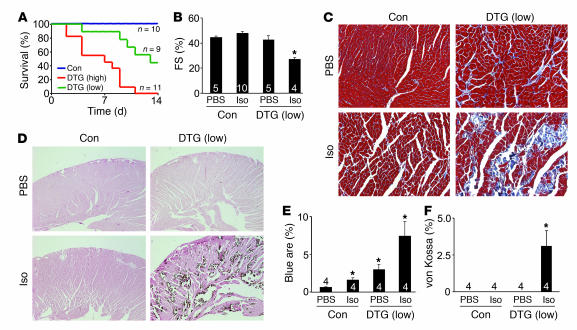
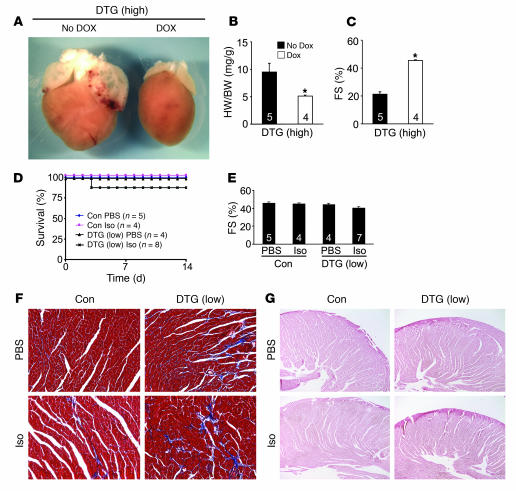
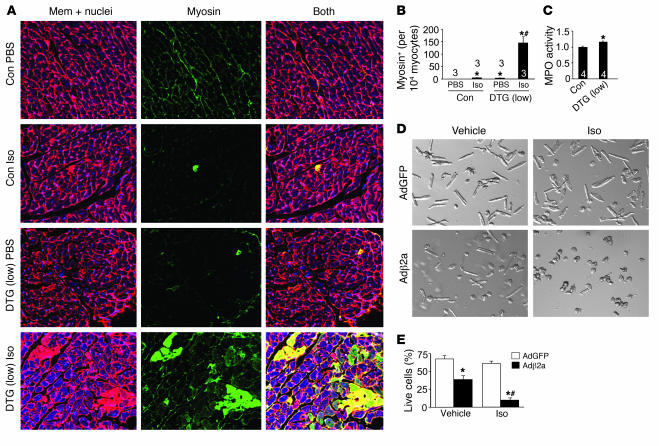
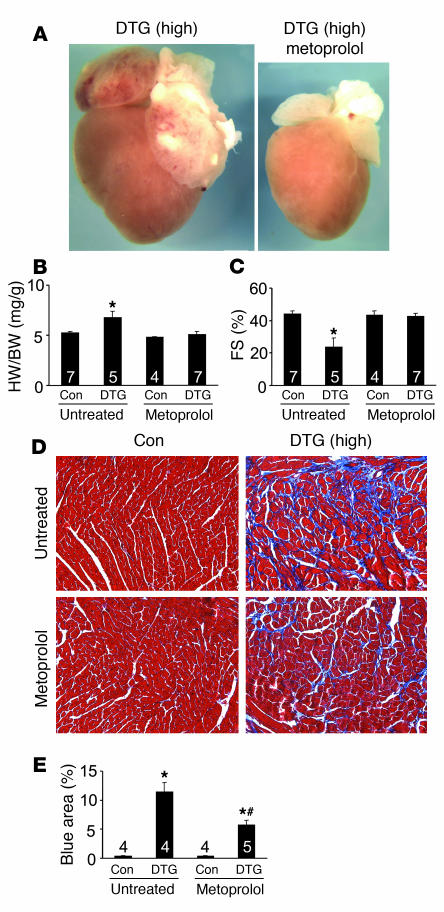
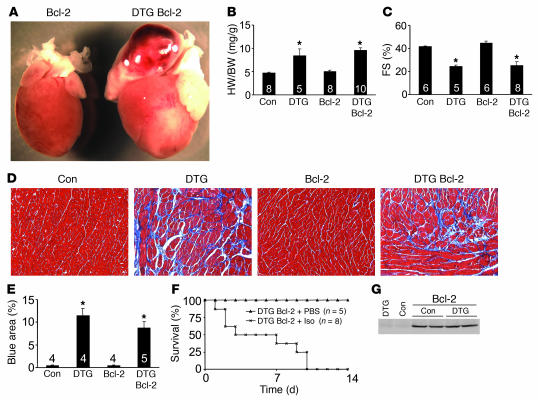
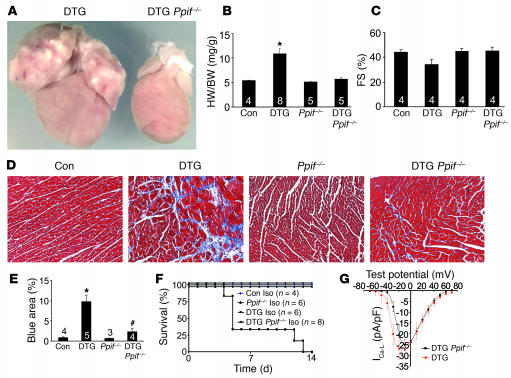
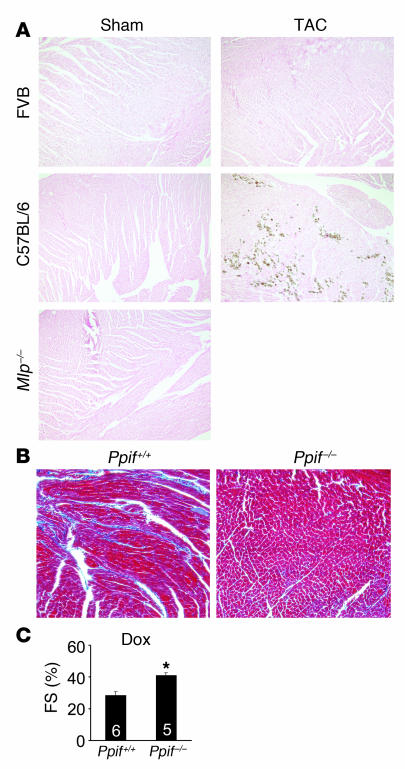
Loss of cardiac myocytes in heart failure is thought to occur largely through an apoptotic process. Here we show that heart failure can also be precipitated through myocyte necrosis associated with Ca2+ overload. Inducible transgenic mice with enhanced sarcolemmal L-type Ca2+ channel (LTCC) activity showed progressive myocyte necrosis that led to pump dysfunction and premature death, effects that were dramatically enhanced by acute stimulation of beta-adrenergic receptors. Enhanced Ca2+ influx-induced cellular necrosis and cardiomyopathy was prevented with either LTCC blockers or beta-adrenergic receptor antagonists, demonstrating a proximal relationship among beta-adrenergic receptor function, Ca2+ handling, and heart failure progression through necrotic cell loss. Mechanistically, loss of cyclophilin D, a regulator of the mitochondrial permeability transition pore that underpins necrosis, blocked Ca2+ influx-induced necrosis of myocytes, heart failure, and isoproterenol-induced premature death. In contrast, overexpression of the antiapoptotic factor Bcl-2 was ineffective in mitigating heart failure and death associated with excess Ca2+ influx and acute beta-adrenergic receptor stimulation. This paradigm of mitochondrial- and necrosis-dependent heart failure was also observed in other mouse models of disease, which supports the concept that heart failure is a pleiotropic disorder that involves not only apoptosis, but also necrotic loss of myocytes in association with dysregulated Ca2+ handling and beta-adrenergic receptor signaling.


Figures

Figure 1
Figure 1. Generation of inducible transgenic mice with increased LTCC activity.
(A) Schematic of the bitransgenic inducible expression system used to regulate β2a expression in the mouse heart. tetR, tet-repressor cDNA fused to VP16 (activator domain); tetO, tet-operator; TRE, thyroid hormone regulatory element. (B) Western blot analysis of β2a protein levels in the heart of low-, medium-, and high-expressing DTG mice raised without Dox (induced state). Levels of α1c, α2δ, SERCA2a, PLN, and NCX1 were unchanged. Con, control tTA single-transgenic mice. (C) Western blots showing inducible expression of β2a in low- and high-expressing DTG mice without Dox and its extinguishment with 2–3 weeks of Dox administration. TG, β2a transgene alone (without the driver tTA transgene). Control samples were from tTA single-transgenic mice.
Figure 2
Figure 2. Analysis of Ca2+ handling in β2a-inducible transgenic mice.
(A) Ca2+ current (ICa-L) at different test potentials from adult myocytes isolated from control wild-type mice or low-expressing DTG mice without Dox administration. From 3 independent mice per group, 17 myocytes from control hearts and 11 myocytes from DTG hearts were analyzed. (B) Representative Ca2+ transients from control wild-type and DTG myocytes measured as a change in fluorescence. (C) Assessment of cellular fractional shortening (FS) after isolation from control wild-type and low-expressing DTG mice. Numbers indicate the number of cells analyzed in each group. *P < 0.05 versus wild-type, Student’s t test. (D) Isolated working heart preparation to measure ± dP/dt in control wild-type and low-expressing DTG mice at 14 weeks of age. Numbers indicate the number of hearts analyzed in each group. *P < 0.05 versus wild-type, Student’s t test. (E) Current associated with NCX activity in adult myocytes isolated from control wild-type and low-expressing DTG mouse hearts. Numbers indicate the number of cells analyzed in each group. *P < 0.05 versus wild-type, Student’s t test. (F) RT-PCR for atrial natriuretic factor (ANF), skeletal α-actin (αSkA), SERCA2, PLN, or L7 (control) from hearts of control wild-type mice as well as low- and high-expressing DTG mice (n = 3 per group).
Figure 3
Figure 3. Cardiac phenotype of β2a DTG mice.
(A) Kaplan-Meier curves of death with aging in control tTA single-transgenic and low-expressing DTG mice. (B) Heart weight (HW) normalized to body weight (BW) for control wild-type, tTA single-transgenic, and high- and low-expressing DTG mice at 4 months of age. Numbers indicate the number of mice analyzed in each group. *P < 0.05 versus wild-type and tTA single-transgenic, Student’s t test. (C) Fractional shortening assessment by echocardiography in the indicated groups. Numbers indicate the number of mice analyzed in each group. *P < 0.05 versus control, Student’s t test. (D) Histological assessment of cardiac ventricular pathology by H&E, Masson’s trichrome (Tri), and von Kossa staining in control wild-type and low- and high-expressing DTG mice. Arrowheads denote regions of von Kossa–detected Ca2+ overload. Original magnification, ×100. (E) Quantitation of fibrotic area (blue) from trichrome-stained cardiac histological sections. Numbers indicate the number of mouse hearts analyzed in each group. *P < 0.05 versus control; #P < 0.05 versus low-expressing DTG, Student’s t test. (F) Assessment of TUNEL-positive myocyte nuclei from hearts of the indicated mice. Numbers indicate the number of hearts analyzed in each group. *P < 0.05 versus control, Student’s t test.
Figure 4
Figure 4. Verapamil reduces cardiac pathology in β2a DTG mice.
(A) Gross morphological view of hearts from a high-expressing DTG β2a mouse with or without verapamil treatment (4 months of age). (B) Heart weight normalized to body weight for control tTA single-transgenic and high-expressing DTG mice with or without verapamil. Numbers indicate the number of mice analyzed in each group. *P < 0.05 versus untreated control, ANOVA. (C) Fractional shortening assessment by echocardiography in control tTA single-transgenic and high-expressing DTG mice with or without verapamil. Numbers indicate the number of mice analyzed in each group. *P < 0.05 versus untreated control, ANOVA. (D) Histological assessment of cardiac ventricular pathology by H&E, Masson’s trichrome, and von Kossa staining in control tTA single-transgenic and high-expressing DTG mice with or without verapamil. Original magnification, ×200. (E) Quantitation of fibrotic area (blue) from trichrome-stained cardiac histological sections. Numbers indicate the number of sections analyzed in each group. *P < 0.05 versus control, ANOVA.
Figure 5
Figure 5. Iso infusion dramatically enhances β2a-dependent disease and death.
(A) Kaplan-Meier curves of control tTA single-transgenic as well as low- and high-expressing DTG mice infused with Iso at 60 mg/kg/d for 14 days. (B) Fractional shortening assessment by echocardiography in control tTA single-transgenic and low-expressing DTG mice with Iso or PBS treatment. Only low-expressing DTG mice were used because 44% survived the 14 days of Iso treatment. Numbers indicate the number of mice analyzed in each group. *P < 0.05 versus control with PBS, ANOVA. (C) Histological assessment of cardiac ventricular pathology by Masson’s trichrome in control tTA single-transgenic and low-expressing DTG mice with Iso or PBS infusion for 14 days. (D) Histological assessment of Ca2+ deposits in myocytes by von Kossa staining in control tTA single-transgenic and low-expressing DTG mice with Iso or PBS infusion for 14 days. Original magnification, ×200 (C); ×40 (D). (E) Quantitation of fibrotic area (blue) from trichrome-stained cardiac histological sections. Numbers indicate the number of mice analyzed in each group (10 photographs quantified per mouse heart). *P < 0.05 versus PBS-infused control, ANOVA. (F) Quantitation of areas of myocytes with Ca2+ deposits in control tTA single-transgenic and low-expressing DTG mice with Iso or PBS infusion for 14 days. *P < 0.05 versus PBS-infused DTG, Student’s t test.
Figure 6
Figure 6. Dox-induced shut-off of the β2a transgene prevents disease.
(A) Gross morphological pictures of high-expressing DTG β2a mice without Dox treatment (No Dox; induced) or with Dox (shut off) at 14 weeks of age. (B) Heart weight normalized to body weight and (C) fractional shortening in high-expressing DTG mice without Dox or with Dox. Numbers indicate the number of mice analyzed in each group. *P < 0.05 versus DTG without Dox, Student’s t test. (D) Kaplan-Meier curves of control tTA single-transgenic and low-expressing DTG mice infused with Iso at 60 mg/kg/d for 14 days or with PBS vehicle. Low-expressing DTG mice were given Dox for 2 weeks prior to shut off β2a expression. (E) Fractional shortening in control tTA single-transgenic and low-expressing DTG mice pretreated with Dox for 2 weeks; some were given 14 days of Iso treatment. Numbers indicate the number of mice analyzed in each group. Data were analyzed by ANOVA. (F) Histological assessment of cardiac ventricular pathology by Masson’s trichrome in control tTA single-transgenic and low-expressing DTG mice with PBS or Iso infusion for 14 days with 2 weeks of prior Dox treatment. (G) Histological assessment of Ca2+ deposits in myocytes by von Kossa staining in control tTA single-transgenic and low-expressing DTG mice with PBS or Iso infusion for 14 days with 2 weeks of prior Dox treatment.
Figure 7
Figure 7. Assessment of myocyte necrosis.
(A) Immunohistochemistry for myosin antibody incorporation into the heart (green) in control tTA single-transgenic and low-expressing DTG mice with PBS vehicle or Iso infusion for 24 hours. Red is a wheat germ agglutinin stain (TRITC conjugated) for cell membranes (Mem); nuclei are shown in blue. (B) Percentage of cells with myosin antibody infiltration per 10,000 myocytes counted. Numbers indicate the number of mice analyzed in each group. *P < 0.05 versus PBS-infused control; #P < 0.05 versus Iso-infused control, ANOVA. (C) Myeloperoxidase (MPO) activity in hearts that were first perfused to remove any blood contamination and then assayed. Control was arbitrarily set to a value of 1. Numbers indicate the number of mice analyzed in each group. *P < 0.05 versus control, Student’s t test. (D) Cultured adult feline ventricular myocytes infected with the indicated recombinant adenoviruses (Ad) and treated with vehicle or Iso. (E) Cells in D were quantified as the percentage of living rod-shaped cells (n = 4 experiments). *P < 0.05 versus AdGFP; #P < 0.05 versus vehicle-infused Adβ2a. Original magnification, ×400 (A); ×100 (D).
Figure 8
Figure 8. Blocking β-adrenergic receptor prevents disease in high-expressing DTG mice.
(A) Gross morphological view of hearts from high-expressing DTG β2a mice (4 months of age) with or without metoprolol treatment. (B and C) Heart weight normalized to body weight (B) and fractional shortening assessment (C) for control tTA single-transgenic and high-expressing DTG mice with or without metoprolol. Numbers indicate the number of mice analyzed in each group. *P < 0.05 versus untreated control, ANOVA. (D) Histological assessment of cardiac ventricular pathology by Masson’s trichrome staining in the indicated mice. Original magnification, ×200. (E) Quantitation of fibrotic area (blue) from trichrome-stained cardiac histological sections. Numbers indicate the number of sections analyzed in each group. *P < 0.05 versus untreated control; #P < 0.05 versus DTG without metoprolol, ANOVA.
Figure 9
Figure 9. Bcl-2 overexpression does not rescue β2a overexpression–dependent disease.
(A) Gross morphological view of hearts from a Bcl-2 single-transgenic mouse and a mouse with both the Bcl-2 transgene and the β2a double transgenes without Dox (4 months of age). (BE) Heart weight normalized to body weight (B), fractional shortening assessment (C), histological assessment of cardiac pathology by Masson’s trichrome staining (D), and quantitation of fibrotic area (blue) from trichrome-stained cardiac sections (E) for control tTA single-transgenic mice, DTG mice, Bcl-2 single-transgenic mice, and DTG mice with the Bcl-2 transgene. Numbers indicate the number of mice analyzed in each group (E, 10 photographs each). Original magnification, ×200 (D). *P < 0.05 versus control, ANOVA. (F) Kaplan-Meier curves from DTG mice containing the Bcl-2 transgene infused with Iso at 60 mg/kg/d for 14 days or with PBS. (G) Western blot for Bcl-2 protein from the hearts of control tTA single-transgenic and DTG mice. GAPDH protein levels did not vary between samples (not shown).
Figure 10
Figure 10. Loss of cyclophilin D rescues disease in β2a-overexpressing mice.
(A) Gross morphological view of hearts from a DTG mouse and a DTG mouse lacking Ppif without Dox (4 months of age). (BE) Heart weight normalized to body weight (B), fractional shortening assessment (C), histological assessment of cardiac pathology by Masson’s trichrome staining (D), and quantitation of fibrotic area (blue) from trichrome-stained cardiac histological sections (E) for control tTA single-transgenic, DTG, Ppif–/–, and DTG Ppif–/– mice. Numbers indicate the number of mice analyzed in each group (E, 10 photographs each). Original magnification, ×200 (D). *P < 0.05 versus control; #P < 0.05 versus DTG, ANOVA. (F) Kaplan-Meier curves from control tTA single-transgenic mice, Ppif–/– mice, and DTG mice with or without Ppif infused with Iso at 60 mg/kg/d for 14 days. (G) Ca2+ current at different test potentials from adult myocytes isolated from DTG mice (n = 9) or DTG Ppif–/– mice (n = 8). Both show equivalently high currents compared with control wild-type cells shown in Figure 2A.
Figure 11
Figure 11. Analysis of necrosis antecedents in other mouse models.
(A) von Kossa staining from hearts of the indicated mice subjected to sham surgery or TAC. Mlp–/– mice were analyzed at baseline, without any surgical intervention. (B) Masson’s trichrome staining and (C) fractional shortening in control Ppif+/+ and Ppif–/– mice 2 weeks after Dox injection (15 mg/kg i.p.). *P < 0.05 versus control, Student’s t test. Original magnification, ×100 (A and B).

References

    1. Hobbs R.E. Guidelines for the diagnosis and management of heart failure. Am. J. Ther. 2004;11:467–472. - PubMed
    1. Levy D., et al. Long-term trends in the incidence of and survival with heart failure. N. Engl. J. Med. 2002;347:1397–1402. - PubMed
    1. Zannad F., et al. Incidence, clinical and etiologic features, and outcomes of advanced chronic heart failure: the EPICAL Study. Epidemiologie de l’Insuffisance Cardiaque Avancee en Lorraine. . J. Am. Coll. Cardiol. 1999;33:734–742. - PubMed
    1. Haldeman G.A., Croft J.B., Giles W.H., Rashidee A. Hospitalization of patients with heart failure: National Hospital Discharge Survey, 1985 to 1995. Am. Heart. J. 1999;137:352–360. - PubMed
    1. Malek M. Health economics of heart failure. Heart. 1999;82(Suppl. 4):IV11–IV13. - PMC - PubMed

Publication types

MeSH terms