. 2007 Sep;5(9):e219.
doi: 10.1371/journal.pbio.0050219.

Adaptive variation in beach mice produced by two interacting pigmentation genes

Affiliations

Adaptive variation in beach mice produced by two interacting pigmentation genes

Cynthia C Steiner et al. PLoS Biol. 2007 Sep.

Erratum in

  • PLoS Biol. 2008 Feb;6(2):e36

Abstract

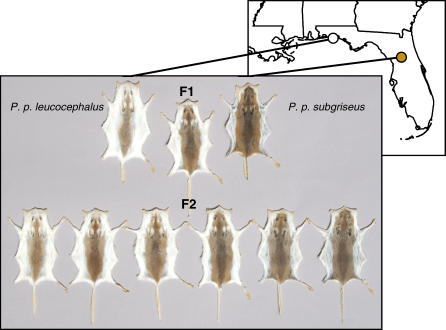
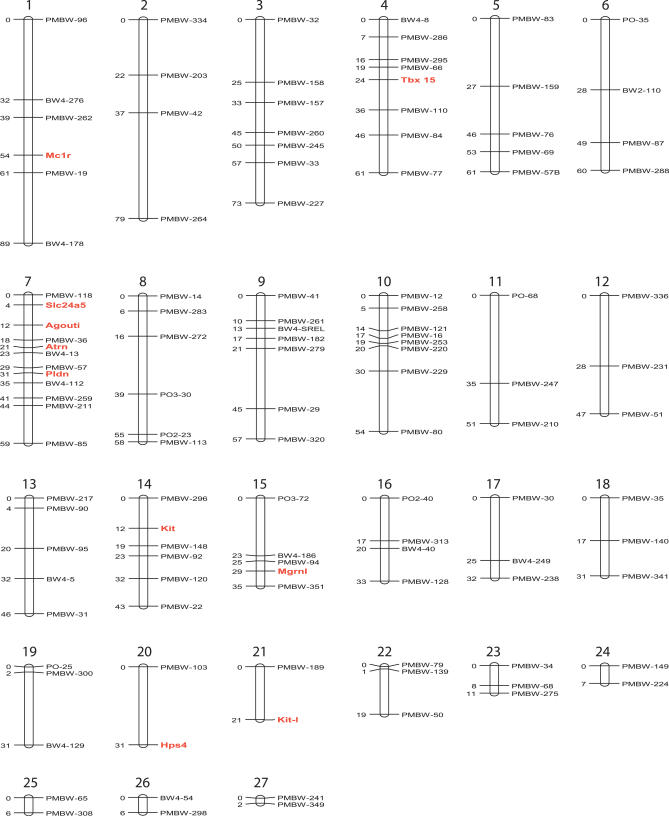
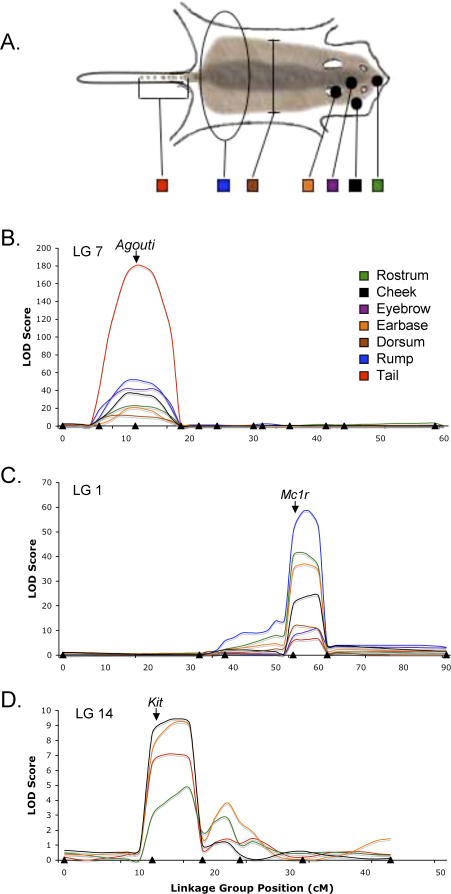
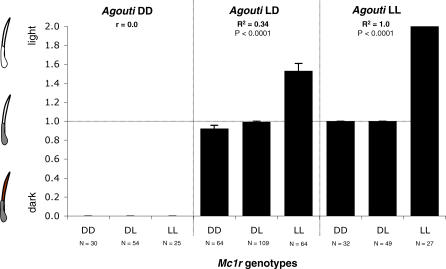
Little is known about the genetic basis of ecologically important morphological variation such as the diverse color patterns of mammals. Here we identify genetic changes contributing to an adaptive difference in color pattern between two subspecies of oldfield mice (Peromyscus polionotus). One mainland subspecies has a cryptic dark brown dorsal coat, while a younger beach-dwelling subspecies has a lighter coat produced by natural selection for camouflage on pale coastal sand dunes. Using genome-wide linkage mapping, we identified three chromosomal regions (two of major and one of minor effect) associated with differences in pigmentation traits. Two candidate genes, the melanocortin-1 receptor (Mc1r) and its antagonist, the Agouti signaling protein (Agouti), map to independent regions that together are responsible for most of the difference in pigmentation between subspecies. A derived mutation in the coding region of Mc1r, rather than change in its expression level, contributes to light pigmentation. Conversely, beach mice have a derived increase in Agouti mRNA expression but no changes in protein sequence. These two genes also interact epistatically: the phenotypic effects of Mc1r are visible only in genetic backgrounds containing the derived Agouti allele. These results demonstrate that cryptic coloration can be based largely on a few interacting genes of major effect.


Conflict of interest statement

Competing interests. The authors have declared that no competing interests exist.

Figures

Figure 1
Figure 1. Pigmentation Patterns of a Beach Mouse (P. polionotus leucocephalus), a Mainland Mouse (P. p. subgriseus), the Resulting Hybrid (F1), and the Second-Generation Reciprocal-Intercross Progeny (F2)
The parental strains were from Santa Rosa Island, Florida, United States (white circle) and Ocala National Forest, Florida, United States (brown circle). Based on quantitative measurements, parental subspecies differ significantly in seven pigmentation traits (Student's t-test, p < 0.001). For some traits, F1 hybrids are intermediate between the parental phenotypes (e.g., earbase pigmentation), while for others they are more similar to either the beach parents (e.g., lack of a tail stripe) or to mainland parents (e.g., extent of dorsal pigmentation), suggesting variation in the degree of additivity and dominance of alleles contributing to the light phenotype. The F2 progeny show continuous phenotypic variation in pigmentation patterns, consistent with a multigenic basis of patterning variation. However, parental phenotypes are recovered in the F2 progeny, suggesting that differences in pigmentation are controlled by a small number of genes.
Figure 2
Figure 2. A Genome-Wide Linkage Map of P. polionotus Comprising 27 LGs Ordered by Size
Microsatellite loci are indicated in black and candidate pigmentation genes in red. The cumulative genetic distance between markers is given in centimorgans (cM). All candidate genes were on separate LGs with the exception of Pldn, Atrn, Slc24a5, and Agouti, which clustered on LG 7. A total of three microsatellite loci and one pigmentation gene Tyr failed to show linkage to any other markers.
Figure 3
Figure 3. Genetic Architecture of Pigmentation in a Cross between Beach and Mainland Subspecies
(A) Each of seven pigmentation traits for which we found significant QTLs is highlighted in a different color on a cartoon of a mouse pelt. MQM analyses showed that two LGs harbored major effect QTLs and one LG carried a minor effect QTL. For each LG, LOD scores are shown as a function of genetic distance in centimorgans (cM). Black triangles on x-axes show the position of marker loci. Each line indicates the LOD score at 5-cM intervals along the LG and are coded by colors corresponding to each of the seven traits. (B) One region of major affect maps to LG 7 and the Agouti locus maps to the peak in LOD score. (C) A second major-effect region is located on LG 1, and the Mc1r locus maps to the peak in LOD score. Both major-effect loci are statistically associated with all seven pigmentation traits studied. (D) A QTL of minor effect is located in LG 14, and the Kit locus maps near the peak. This minor effect locus is associated with four of the seven pigmentation traits.
Figure 4
Figure 4. Gene Expression Assays for Mc1r and Agouti in Five Pigmentation Regions in Three Peromyscus Taxa
(A) Phylogenetic relationship and approximate divergence times are shown for the P. polionotus subspecies and the sister species P. maniculatus. Photos show typical pigmentation pattern for each taxon. The phylogeny and pictures together highlight the similarity in pigmentation patterns between the mainland P. polionotus and P. maniculatus, the close evolutionary relationship between P. polionotus subspecies, and the derived nature of the beach mouse phenotype. (B) Qualitative (RT-PCR) and qPCR expression levels of Mc1r and Agouti mRNA relative to beta-Actin (control gene) for five distinct tissue samples in P. polionotus subspecies (P. p. leucocephalus [Ppl; white] and P. p. subgriseus [Pps; brown]) and P. maniculatus (Pm; black) are shown. A 100-bp ladder (L) flanks both sides of the RT-PCR gels. For the qPCR assays, since low Ct values indicate high expression level, we transformed the raw expression data to be more intuitive: relative expression values represent the averaged Ct values for each species subtracted from the sum of expression values across all species. Significant differences in relative expression levels between P. polionotus subspecies are indicated by asterisks (Student's t-test, p < 0.05). Bars indicate the standard error for each assay. (C) Association between level of Mc1r and Agouti relative expression and pigmentation (measured by reflectance) is shown among the three taxa. Correlation (r) values are shown.
Figure 5
Figure 5. Interaction between Agouti and Mc1r Genes for One Trait, Cheek Pigmentation
Black bars represent the mean phenotypic score for each Mc1r genotype when F2 progeny were clustered by Agouti genotype; alleles are indicated by dark (D) and light (L). Phenotypic values were taken for each of 465 F2 progeny, scored as 2 (no visible pigment), 1 (partially pigmented), and 0 (fully pigmented) as indicated by the cartoons of individual hairs. Sample size and standard error bars are provided. R 2 and p-values obtained by χ2 test are shown for each Agouti genotype, indicating the amount of phenotypic variation explained by Mc1r genotype in the F2 progeny.

References

    1. Sumner FB. The analysis of a concrete case of intergradation between two subspecies. Proc Natl Acad Sci U S A. 1929;15:110–120. - PMC - PubMed
    1. Sumner FB. The analysis of a concrete case of intergradation between two subspecies. II. Additional data and interpretations. Proc Natl Acad Sci U S A. 1929;15:481–493. - PMC - PubMed
    1. Sumner FB. Genetic and distributional studies of three subspecies of Peromyscus . J Genet. 1930;23:275–376.
    1. Kaufman DW. Adaptive coloration in Peromyscus polionotus: Experimental selection by owls. J Mammal. 1974;55:271–283.
    1. Blair WF. Population structure, social behavior, and environmental relations in a natural population of the beach mouse (Peromyscus polionotus) . Contr Lab Vert Biol, U Mich. 1951;48:1–47.

Publication types

Substances