. 2007 Sep;5(9):e221.
doi: 10.1371/journal.pbio.0050221.

An actin-based wave generator organizes cell motility

Affiliations

An actin-based wave generator organizes cell motility

Orion D Weiner et al. PLoS Biol. 2007 Sep.

Abstract

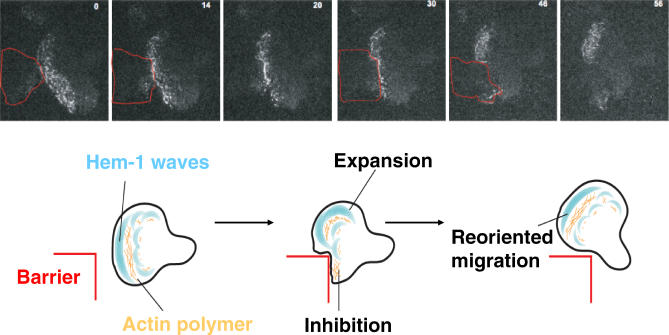
Although many of the regulators of actin assembly are known, we do not understand how these components act together to organize cell shape and movement. To address this question, we analyzed the spatial dynamics of a key actin regulator--the Scar/WAVE complex--which plays an important role in regulating cell shape in both metazoans and plants. We have recently discovered that the Hem-1/Nap1 component of the Scar/WAVE complex localizes to propagating waves that appear to organize the leading edge of a motile immune cell, the human neutrophil. Actin is both an output and input to the Scar/WAVE complex: the complex stimulates actin assembly, and actin polymer is also required to remove the complex from the membrane. These reciprocal interactions appear to generate propagated waves of actin nucleation that exhibit many of the properties of morphogenesis in motile cells, such as the ability of cells to flow around barriers and the intricate spatial organization of protrusion at the leading edge. We propose that cell motility results from the collective behavior of multiple self-organizing waves.


Conflict of interest statement

Competing interests. The authors have declared that no competing interests exist.

Figures

Figure 1
Figure 1. Hem-1 Component of the WAVE2 Complex Localizes to Multiple Propagating Waves in Chemoattractant-Stimulated HL-60 Cells
(A) HL-60 cells expressing Hem-1-YFP continually exposed to chemoattractant (20 nM fMLP)—see Video S1 and Video S2. Hem-1 initially concentrates in foci, which form outwardly propagating waves that eventually develop into a polarized accumulation of Hem-1 at the leading edge (denoted by arrow at 112 s). Panels five and six overlay successive Hem-1 distributions in red, blue, and green successively. (B) Hem-1 waves concentrate at the ruffled leading edge of polarized cells (leading edge identified by arrow in Nomarski panel). Nomarski (Video S3), Hem-1-YFP (Video S4), and overlay (Video S5) of polarized HL-60 cell exposed to 20nM fMLP. (C) Leading edge advance is highly correlated with underlying Hem-1 waves. The top panel shows position of leading edge (blue circles and white cell outline), most peripheral Hem-1 wave (red triangles), and more interior Hem-1 wave (black squares). As the peripheral wave is extinguished, the leading edge stalls and resumes movement once the interior wave approaches the leading edge. The lower panel displays distances relative to initial position of leading edge. (D) TIRF membrane control. C5A receptor-GFP (which is uniformly distributed on the plasma membrane) is uniformly distributed in the TIRF field. An arrow in the first panel denotes the leading edge. (E) Hem-1 waves exhibit a spatial gradient in velocity (first panel) and lifetime (second panel) with respect to the leading edge. (F) HL-60 cells acutely stimulated with chemoattractant (20 nM fMLP) produce a uniform field of Hem-1 spots, which asymmetrically disappear, are retained at one end of the cell (arrow), and begin generating Hem-1 waves (Video S7).
Figure 2
Figure 2. Rac Activity and the Arp2/3 Complex Spatially Correlate with but Are more Homogeneous than Hem-1 Waves
(A) Pak-GBD-YFP (Rac activity probe) dynamics during acute cell stimulation (chemoattractant added to pre-polarized cell at t = 0 s)—see Video S8. Rac activation is initially uniform and then polarizes (arrow), similar to the spatial dynamics of Hem-1 waves (compare to Figure 4B). Rac exhibits relatively homogeneous zones of activation in contrast to discrete points and waves of Hem-1. (B) Rac activity dynamics during cell migration (see Video S9). Rac-GTP (assayed by Pak-GBD-YFP) concentrates at the leading edge (and dominant pseudopod when multiple pseudopodia are present) in cells migrating in uniform chemoattractant. Green dots are included in first and last frame as fiduciary marks to clarify relative cell positions. (C) The Arp3-GFP component of the Arp2/3 complex fills the leading edge (arrow) and exhibits a more homogeneous distribution than Hem-1 waves (Video S10). The cell is representative of more than five similar cells. (D) Actin-YFP is more homogeneously distributed than Hem-1 waves throughout the leading edge of polarized cells. Latrunculin treatment of actin-YFP–expressing cell abolishes leading edge accumulation of actin-YFP. Cells are representative of more than five similar cells.
Figure 3
Figure 3. Hem-1 Waves Result from Propagated Recruitment and Release of Hem-1, Not a Moving Front of Translocated Protein
(A) Control Hem-1-YFP–expressing cells (pre-polarized in uniform chemoattractant) rapidly recover fluorescence intensity following photobleaching, indicating rapid exchange of membrane-bound Hem-1 with the cytosolic pool (Video S11). (B) Depolymerization of the actin cytoskeleton with latrunculin inhibits the recovery of Hem-1-YFP fluorescence intensity following photobleaching indicating a lack of exchange of Hem-1 in the absence of actin polymers. Cells were first stimulated with uniform fMLP, treated with latrunculin until the intensity of membrane-bound Hem-1 stabilized (greater than 3 min), and then a 1–2-μm radius spot was photobleached. (C) Quantitation of Hem-1-YFP intensity following photobleaching of control (black, n = 4 cells) or latrunculin-treated cells (red, n = 5 cells). The right panel represents fit of control cell Hem-1 FRAP data (half-life on membrane = 6.4 s, obtained from four cells). (D) Cell with single dominant peripheral Hem-1 wave and multiple interior waves shows a clear refractory region between the most peripheral Hem-1 wave (green dot) and the next wave (red dot)—see Video S12. Final panel is kymograph of the same cell. Vertical axis of the kymograph is time and horizontal axis is spatial position corresponding to dotted line in first and third panels. The kymograph shows several sets of waves (leading edge green dot, subsequent waves red dots) with clear gaps between them. The bottom schematic indicates our working model— Hem-1 waves (blue) deposit an inhibitor in their wake (orange) that transiently inhibits Hem-1 recruitment. We later present data that actin polymer represents a component of this inhibitor. (E) Annihilation of two colliding Hem-1 wavefronts (one green dot, one red dot at t = 0) in single cell (Video S13). Waves collide at 8 s (red dot) and are both extinguished by 20 s (red dot). The bottom schematic indicates our interpretation of colliding waves. Hem-1 waves (blue) deposit an inhibitor in their wake (orange), leading to annihilation of colliding waves. This property could enable cells to focus wave propagation and actin polymerization toward the cell periphery.
Figure 4
Figure 4. Actin Polymers Are Required for Wave Movement and Hem-1 Recycling
(A) Hem-1 waves in control cells (Video S14), cells treated with latrunculin (which sequesters actin monomers, leading to depolymerization of the actin cytoskeleton, Video S15 and S16), or cells treated with jasplakinolide (which stabilizes actin filaments against disassembly, Video S17). All cells were allowed to polarize in response to 20 nM fMLP prior to drug treatment. Red dots are included in all panels as fiduciary marks to clarify relative cell positions between frames. Green arrow at 40 s time point for jasplakinolide-treated cell indicates Hem-1 waves at cell periphery with no significant interior waves. (B) Quantitation of Hem-1 wave velocity (left panel) and lifetime (right panel) for control and drug-treated cells. n = 5–8 cells for each condition for (B–D). (C) Quantitation of Hem-1 wave intensity relative to t = 0 for control and drug-treated cells. (D) Histogram of Hem-1 wave distribution at two different time points in control or jasplakinolide-treated cells.
Figure 5
Figure 5. Hem-1 Waves Extinguish at Mechanical Barriers
Hem-1 waves that collide with boundary (cell outlined in red) are extinguished, whereas those that do not continue to propagate (Video S18). The bottom schematic depicts our hypothesis for barrier avoidance. Hem-1 waves normally propagate just ahead of the actin inhibitory field. Stalling of waves by external barriers prevents Hem-1 from escaping removal by actin polymer-dependent inhibitory process, causing these waves to be extinguished. Waves in other regions of the cell continue to expand, enabling the cell to flow around barriers.
Figure 6
Figure 6. Simulations of Hem-1 Wave Generator
(A) Outline of biological model and mathematical simulations. The Hem-1 wave circuit is wired similarly to other biological waves such as action potentials and relies on autoactivation (Hem-1 recruitment adjacent to existing Hem-1 distributions, which is observed 99% ± 1% of the time in living cells) and delayed inhibition (actin polymers inhibiting Hem-1 membrane association). Membrane-associated Hem-1 locally generates actin polymers via the WAVE2 complex, and more Hem-1 is recruited. After a delay, actin polymers locally remove Hem-1 from the membrane. The process repeats until old actin polymers are ultimately broken down, and the process continues. The lifetime of the actin polymers dictates the length of the gaps between waves. The Matlab code used for Figure 6 is presented in Protocol S1. Our mathematical simulations are based on the parameters listed in Table 1. (B) Simulations of polarity circuit in Figure 6A (Video S19). Combining reciprocal interactions of Hem-1 waves and actin produces Hem-1 waves that lead actin assembly and move with a characteristic gap between waves (roughly corresponding with lifetime of actin polymer). The top panel represents actin polymer, and the bottom panel represents membrane-associated Hem-1. (C) Simulation of colliding waves based on model in Figure 6A (Video S20). The top panel represents actin polymer, and the bottom panel represents membrane-associated Hem-1. Colliding waves annihilate. Compare with colliding Hem-1 waves in living cell Figure 3E and Video S13. (D) Actin depolymerization freezes waves in simulations. The simulation is based on model in Figure 6A (Video S21). Depolymerization of the actin cytoskeleton (by setting formula image 
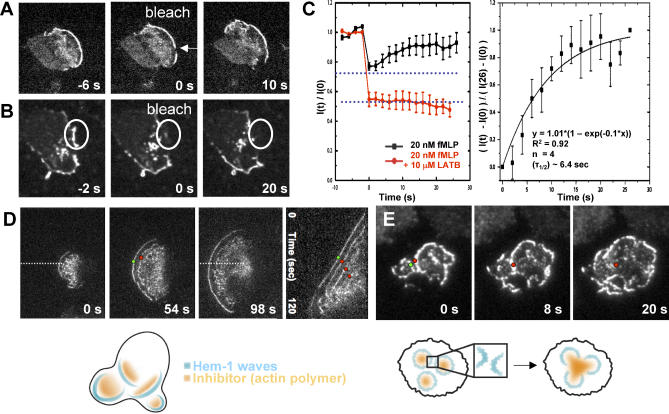
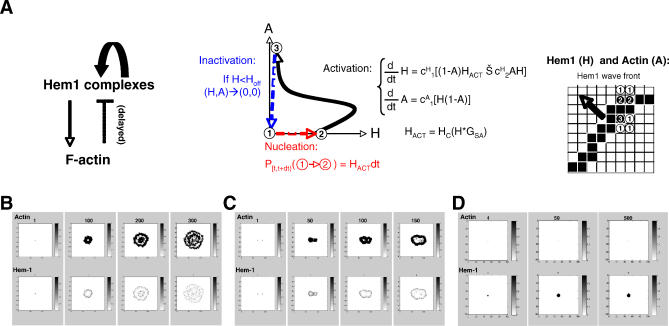
= 0) freezes Hem-1 waves and increases their intensity, mirroring the behavior of living cells (compare with Figure 4A, Videos S15 and S16). The top panel represents actin polymer, and the bottom panel represents membrane-associated Hem-1.

References

    1. Stradal TE, Scita G. Protein complexes regulating Arp2/3-mediated actin assembly. Curr Opin Cell Biol. 2006;18:4–10. - PubMed
    1. Etienne-Manneville S, Hall A. Rho GTPases in cell biology. Nature. 2002;420:629–635. - PubMed
    1. Sun CX, Downey GP, Zhu F, Koh AL, Thang H, et al. Rac1 is the small GTPase responsible for regulating the neutrophil chemotaxis compass. Blood. 2004;104:3758–3765. - PubMed
    1. Ridley AJ, Paterson HF, Johnston CL, Diekmann D, Hall A. The small GTP-binding protein rac regulates growth factor-induced membrane ruffling. Cell. 1992;70:401–410. - PubMed
    1. Eden S, Rohatgi R, Podtelejnikov AV, Mann M, Kirschner MW. Mechanism of regulation of WAVE1-induced actin nucleation by Rac1 and Nck. Nature. 2002;418:790–793. - PubMed

Publication types