. 2008 Apr;7(3):373-84.
doi: 10.1111/j.1601-183X.2007.00348.x. Epub 2007 Aug 13.

Interval timing in genetically modified mice: a simple paradigm

Affiliations

Interval timing in genetically modified mice: a simple paradigm

F Balci et al. Genes Brain Behav. 2008 Apr.

Abstract

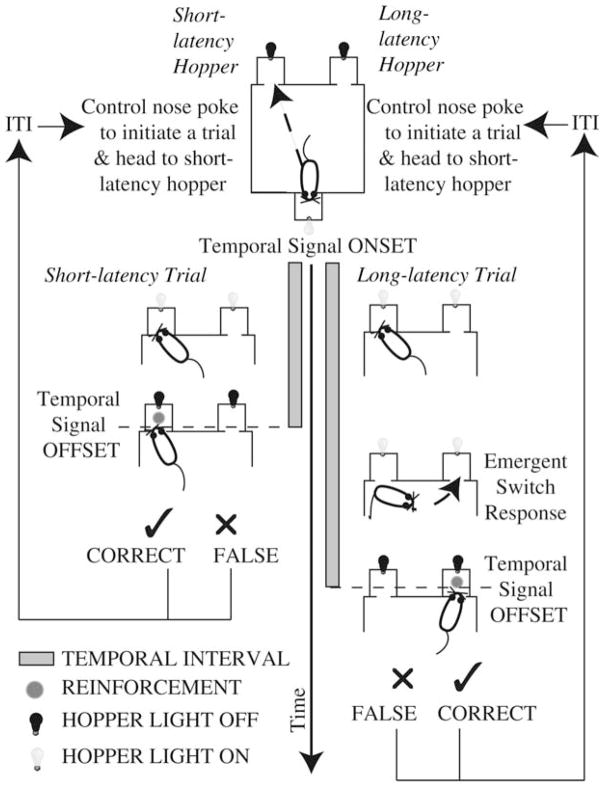
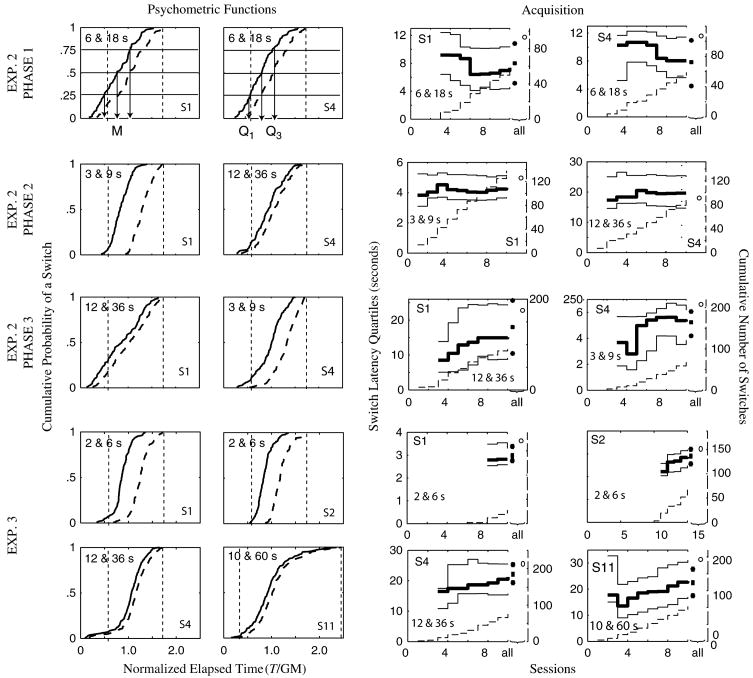
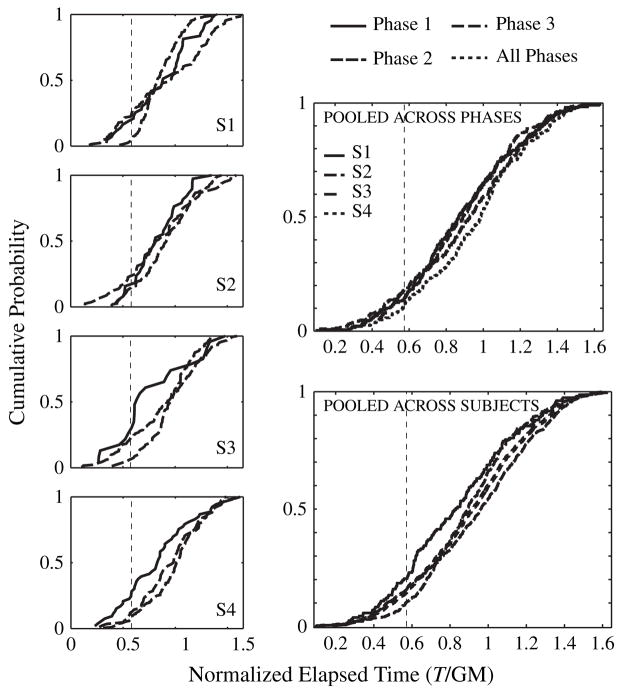
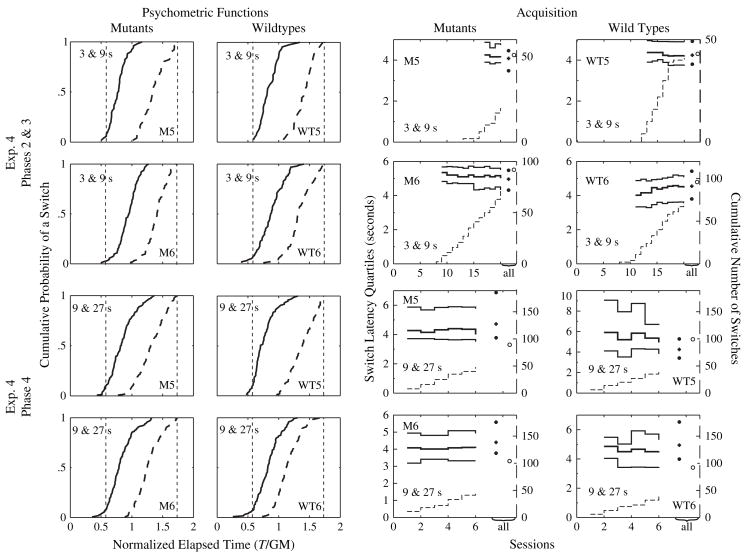
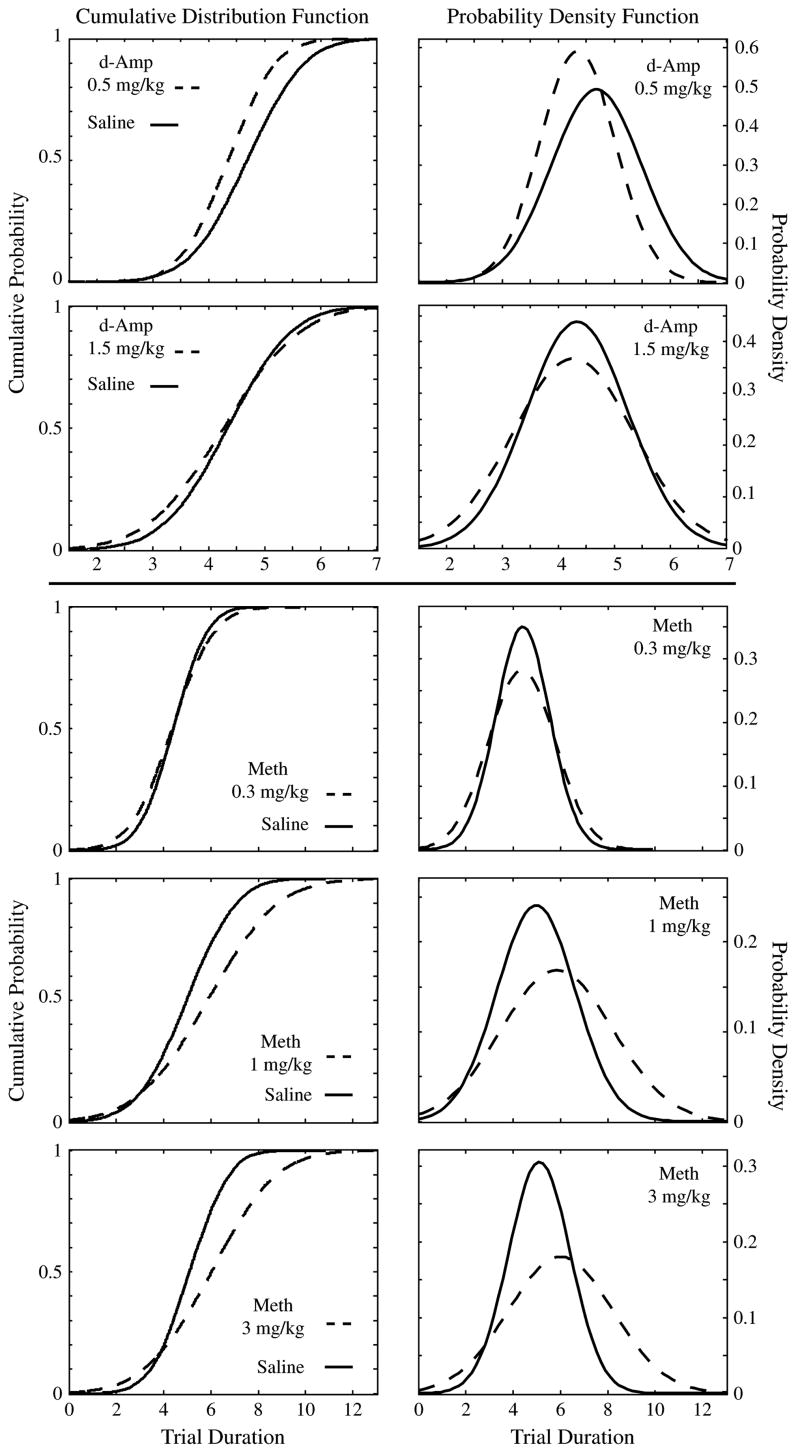
We describe a behavioral screen for the quantitative study of interval timing and interval memory in mice. Mice learn to switch from a short-latency feeding station to a long-latency station when the short latency has passed without a feeding. The psychometric function is the cumulative distribution of switch latencies. Its median measures timing accuracy and its interquartile interval measures timing precision. Next, using this behavioral paradigm, we have examined mice with a gene knockout of the receptor for gastrin-releasing peptide that show enhanced (i.e. prolonged) freezing in fear conditioning. We have tested the hypothesis that the mutants freeze longer because they are more uncertain than wild types about when to expect the electric shock. The knockouts however show normal accuracy and precision in timing, so we have rejected this alternative hypothesis. Last, we conduct the pharmacological validation of our behavioral screen using d-amphetamine and methamphetamine. We suggest including the analysis of interval timing and temporal memory in tests of genetically modified mice for learning and memory and argue that our paradigm allows this to be done simply and efficiently.


Figures

Figure 1
Figure 1. Illustration of the general experimental protocol with nose pokes
In this illustration, the trial-initiating response is included.
Figure 2
Figure 2. Left panel: cumulative distributions of departures (switches, solid curves) and arrivals (dashed curves) from representative subjects plotted against normalized elapsed trial time [trial time, T, divided by the geometric mean (GM) of the short and long intervals]
Intervals are at upper left of each panel; subject ID at lower right. As an illustration, the median is marked on the top left panel with ‘M’, and the first and third quartiles are marked on the top right panel, with ‘Q1’ and ‘Q2’, respectively. Short and long delays are marked by two vertical dashed lines on the normalized scale. Right panel: quartiles of the cumulative switch distributions are plotted against the left ordinates (solid lines), as a function of sessions in Experiments 2 and 3, while the cumulative number of switches is plotted against the right ordinates (dashed lines). In all panels except those for Phase 2 of Experiment 2 (which only lasted for 10 sessions), the solid circles at the extreme right of each panel indicate the quartiles of the final distribution (all switches), while the open circles indicate the total number of switches. These plots correspond to the cumulative distributions presented on the left panel and thus the number indicated by the open circle constitute the number of data points that went into the corresponding cumulative distribution. The durations of the short and long intervals are indicated on each panel, as is the subject ID.
Figure 3
Figure 3. The four figures on the left show the cumulative distributions of switches for the individual subjects in Experiment 2
In a given plot, each distribution is for a given phase of Experiment 2. The top right plot shows the cumulative distribution of switches for each subject for data collapsed across all phases. The bottom right plot shows the cumulative distribution of switches for each phase for data collapsed across all subjects. It also shows the cumulative distribution of switches for data collapsed across all subjects and phases. On the x-axis, trial time (T) is normalized by the geometric mean (GM). In these plots, data from the later sessions were evaluated. The short delay is marked by the vertical dashed line. Long delay is not marked as it falls out of the range of x-axis in the plots.
Figure 4
Figure 4. Left panel: cumulative distributions of departures (switches, solid curves) and arrivals (dashed curves) of representative GRPR mutant and wild-type mice plotted against normalized elapsed trial time [trial time, T, divided by the geometric mean (GM) of the short and long intervals]
Intervals are at upper left of each panel; subject ID at lower right. Short and long temporal intervals are marked by two vertical dashed lines on the normalized scale. Right panel: quartiles of the cumulative switch distributions of representative GRPR mutant and wild-type mice are plotted against the left ordinates (solid lines), as a function of sessions in Experiment 4, while the cumulative number of switches is plotted against the right ordinates (dashed lines). In all panels, the solid circles at the extreme right of each panel indicate the quartiles of the final distribution (all switches), while the open circles indicate the total number of switches. These plots correspond to the cumulative distributions presented on the left panel and thus the number indicated by the open circle constitute the number of data points that went into the corresponding cumulative distribution. The durations of the short and long intervals are indicated on each panel, as is the subject ID.
Figure 5
Figure 5. cdf (left panel) and pdf (right panel) generated from the average mean and SDs gathered under different drug/dose and saline injections
Dashed lines represent distribution of switch latencies gathered under drug injections and solid lines represent distribution of switch latencies gathered under vehicle injections.

Similar articles

Cited by

References

    1. Abner RT, Edwards T, Douglas A, Brunner D. Pharmacology of temporal cognition in two mouse strains. Int J Comp Psychol. 2001;14:189–210.
    1. Balci F, Moore H, Brunner D. Timing deficits in aging and neuropathology. In: Bizon JL, Wood AG, editors. Animal Models of Human Cognitive Aging. Humana Press; Totowa, NJ: in press.
    1. Bevins RA, Ayres JJB. One-trial context fear conditioning as a function of the interstimulus interval. Anim Lear Behav. 1995;23:400–410.
    1. Bevins RA, McPhee JE, Rauhut AS, Ayres JJB. Converging evidence for one-trial context fear conditioning with an immediate shock: importance of shock potency. J Exp Psychol Anim Behav Process. 1997;23:312–324. - PubMed
    1. Çevik MO. Effects of methamphetamine on duration discrimination. Behav Neurosci. 2003;117:774–787. - PubMed

Publication types