. 2007 Aug 14:8:34.
doi: 10.1186/1471-2121-8-34.

GSK-3 inhibitors induce chromosome instability

Affiliations

GSK-3 inhibitors induce chromosome instability

Anthony Tighe et al. BMC Cell Biol. .

Abstract

Background: Several mechanisms operate during mitosis to ensure accurate chromosome segregation. However, during tumour evolution these mechanisms go awry resulting in chromosome instability. While several lines of evidence suggest that mutations in adenomatous polyposis coli (APC) may promote chromosome instability, at least in colon cancer, the underlying mechanisms remain unclear. Here, we turn our attention to GSK-3 - a protein kinase, which in concert with APC, targets beta-catenin for proteolysis - and ask whether GSK-3 is required for accurate chromosome segregation.

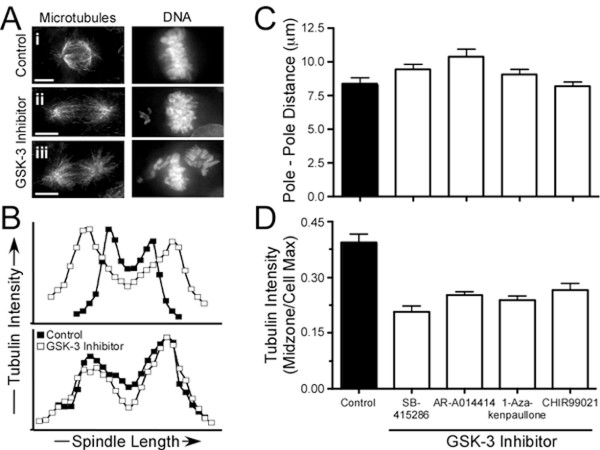
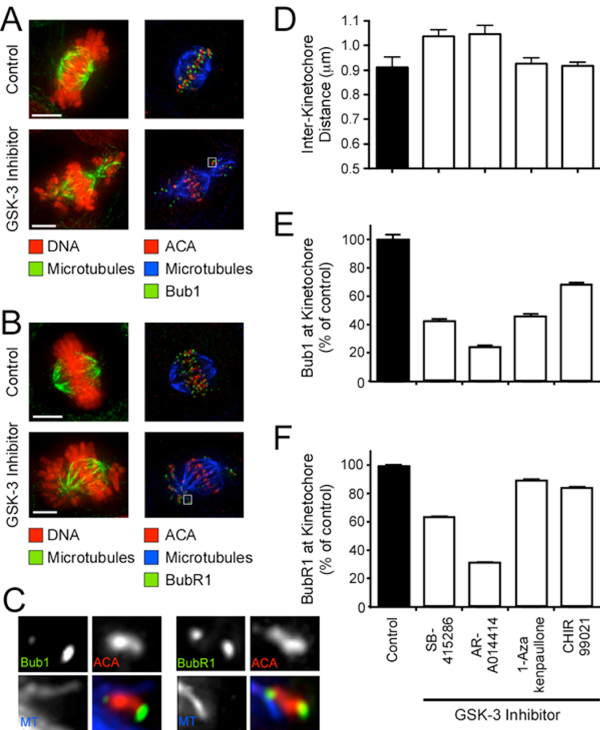
Results: To probe the role of GSK-3 in mitosis, we inhibited GSK-3 kinase activity in cells using a panel of small molecule inhibitors, including SB-415286, AR-A014418, 1-Azakenpaullone and CHIR99021. Analysis of synchronised HeLa cells shows that GSK-3 inhibitors do not prevent G1/S progression or cell division. They do, however, significantly delay mitotic exit, largely because inhibitor-treated cells have difficulty aligning all their chromosomes. Although bipolar spindles form and the majority of chromosomes biorient, one or more chromosomes often remain mono-oriented near the spindle poles. Despite a prolonged mitotic delay, anaphase frequently initiates without the last chromosome aligning, resulting in chromosome non-disjunction. To rule out the possibility of "off-target" effects, we also used RNA interference to selectively repress GSK-3beta. Cells deficient for GSK-3beta exhibit a similar chromosome alignment defect, with chromosomes clustered near the spindle poles. GSK-3beta repression also results in cells accumulating micronuclei, a hallmark of chromosome missegregation.

Conclusion: Thus, not only do our observations indicate a role for GSK-3 in accurate chromosome segregation, but they also raise the possibility that, if used as therapeutic agents, GSK-3 inhibitors may induce unwanted side effects by inducing chromosome instability.


Figures

Figure 1
Figure 1
Small molecule inhibitors of GSK-3. Chemical structures of SB-415286, 1-Azakenpaullone, AR-A014418 and CHIR99021
Figure 2
Figure 2
Identification of small molecules which inhibit GSK-3 in vivo. HeLa and DLD-1 cells were incubated with small molecule GSK-3 inhibitors for 24 hours then analysed by immunoblotting and immunofluorescence. (A) Immunoblot of HeLa cell extracts showing inhibition of glycogen synthase phosphorylation by a subset of GSK-3 inhibitors. (B) Immunoblot of HeLa cell extracts showing that GSK-3 inhibitors do not inhibit Cdk1 phosphorylation of nucleolin. (C) Images of mitotic DLD-1 cells showing examples of abnormal metaphase spindles following exposure to AR-A014418 and 1-Azakenpaullone. (D) Bar graph plotting the number of abnormal metaphases in cells treated with different small molecule GSK-3 inhibitors.
Figure 3
Figure 3
GSK-3 inhibitors delay mitotic entry and exit. HeLa cells were synchronised at G1/S then released into drug-free medium or medium containing either SB-415286 or nocodazole. At the time points indicated the cells, were harvested and analysed by flow cytometry to determine DNA content and mitotic index. (A) DNA content histograms showing that SB-415286 delays cell division. (B) Graph plotting the mitotic index, as determined by MPM-2 reactivity, showing that mitotic progression is delayed in SB-415286 treated cells.
Figure 4
Figure 4
GSK-3 inhibitors delay chromosome alignment. DLD-1 cells expressing a tagged GFP-Histone H2B were incubated in the presence or absence of small molecule GSK-3 inhibitors then analysed by time-lapse microscopy. (A) Control cell showing normal mitosis. (B) SB-415286-treated cells. While cell a completes mitosis normally, chromosome alignment in cell b is delayed (see arrows) and anaphase is initiated despite one unaligned chromosome (see *). (C) Box plot measuring time from prophase to metaphase and metaphase to anaphase for at least 42 cells. (D) Box plot measuring time taken from nuclear envelope breakdown (NEB) to anaphase onset. Values taken from at least 41 cells.
Figure 5
Figure 5
GSK-3 inhibitors yield monopolar and syntelic attachments. DLD-1 cells were incubated with GSK-3 inhibitors for 24 hours then fixed and stained to detect DNA (red), tubulin (green), BubR1 (blue) and centromeres (ACA, red) as indicated. Images represent projections of deconvolved image stacks. (A) Control cell showing examples of bioriented chromosomes. (B) GSK-3 inhibitor treated cell showing that chromosomes near the metaphase plate are bioriented. (C-E) Inhibitor treated cells showing examples of either syntelic attachments (C, Dii, Eii) or monopolar attachments (Di, Ei). Bar is 5 μm when the entire spindle is shown or 1 μm in the enlargements. The cells in C-E were treated with 30 μM SB-415286.
Figure 6
Figure 6
GSK-3 inhibitors weaken the spindle midzone. DLD-1 cells were incubated for 24 hours with GSK-3 inhibitors then fixed and stained to detect the microtubules and the chromosomes. (A) Projections of deconvolved image stacks showing representative mitotic spindles. Scale bar: 5 μm. (B) Graphs plotting tubulin intensity along the spindle axis. (C) Bar graphs plotting pole-pole distance. Values represent the mean and s.e.m. derived from at least 18 cells. (D) Bar graphs quantifying the tubulin intensity at the spindle midzone. Values represent the mean and s.e.m. derived from at least 15 cells. The cells in parts A-B were treated with either 2.5 μM 1-Azakenpaullone or 30 μM SB-415286
Figure 7
Figure 7
GSK-3 inhibitors increase inter-kinetochore distance. Drug-treated DLD-1 cells were fixed and stained to detect centromeres (ACA, red), kinetochores (Bub1 or BubR1, green), microtubules (green or blue) and the chromosomes (red) as indicated. (A, B) Projections of deconvolved image stacks showing reduced levels of Bub1 and BubR1 is at metaphase-kinetochores is reduced in GSK-3 inhibitor treated cells. Scale bars: 5 μm. (C) Projections of deconvolved image stacks showing the asymmetric labelling of Bub1 on the kinetochore of mono-orientated chromosomes. (D) Bar graph quantifying inter-kinetochore distance at metaphase chromosomes. Values represent the mean and s.e.m. derived from at least 20 kinetochores in at least 3 cells. (E, F) Bar graphs quantifying the levels of Bub1 and BubR1 at aligned chromosomes. Values represent the mean and s.e.m. derived from at least 64 kinetochores in at least 3 cells. The cells shown in (A) were treated with 30 μM SB-415286 and in (B) with 10 μM CHIR99021.
Figure 8
Figure 8
GSK-3β RNAi inhibits chromosome alignment. DLD-1 cells were transfected with siRNA duplexes designed to repress GSK-3β then analysed by immunoblot and immunofluorescence. (A) Immunoblot showing repression of GSK-3β. (B) Images of interphase cells showing micronuclei following repression of GSK3-β. (C) Scatter plot quantitating cells with micronuclei. The data is derived from four independent experiments, with each symbol representing an individual coverslip from which a minimum of 1,000 cells was counted. (D) Images of mitotic cells showing chromosome alignment defects in GSK-3β deficient cells. Bar = 5 μm. (E) Box plot quantitating abnormal metaphases in control (black bar) and GSK-3β RNAi (white bar) populations, 48 and 72 hours after transfection. The data is derived from three independent experiments. (F) Bar graphs quantifying the tubulin intensity at the spindle midzone. Values represent the mean and s.e.m. derived from at least 5 cells.

References

    1. Nicklas RB. How cells get the right chromosomes. Science. 1997;275:632–637. doi: 10.1126/science.275.5300.632. - DOI - PubMed
    1. Chan GK, Liu ST, Yen TJ. Kinetochore structure and function. Trends Cell Biol. 2005;15:589–598. doi: 10.1016/j.tcb.2005.09.010. - DOI - PubMed
    1. Cleveland DW, Mao Y, Sullivan KF. Centromeres and kinetochores: from epigenetics to mitotic checkpoint signaling. Cell. 2003;112:407–421. doi: 10.1016/S0092-8674(03)00115-6. - DOI - PubMed
    1. Maiato H, DeLuca J, Salmon ED, Earnshaw WC. The dynamic kinetochore-microtubule interface. J Cell Sci. 2004;117:5461–5477. doi: 10.1242/jcs.01536. - DOI - PubMed
    1. Andrews PD, Knatko E, Moore WJ, Swedlow JR. Mitotic mechanics: the auroras come into view. Curr Opin Cell Biol. 2003;15:672–683. doi: 10.1016/j.ceb.2003.10.013. - DOI - PubMed

Publication types

MeSH terms