

Glycosaminoglycan profiles of repair tissue formed following autologous chondrocyte implantation differ from control cartilage
- PMID: 17697352
- PMCID: PMC2206378
- DOI: 10.1186/ar2278
Glycosaminoglycan profiles of repair tissue formed following autologous chondrocyte implantation differ from control cartilage
Abstract
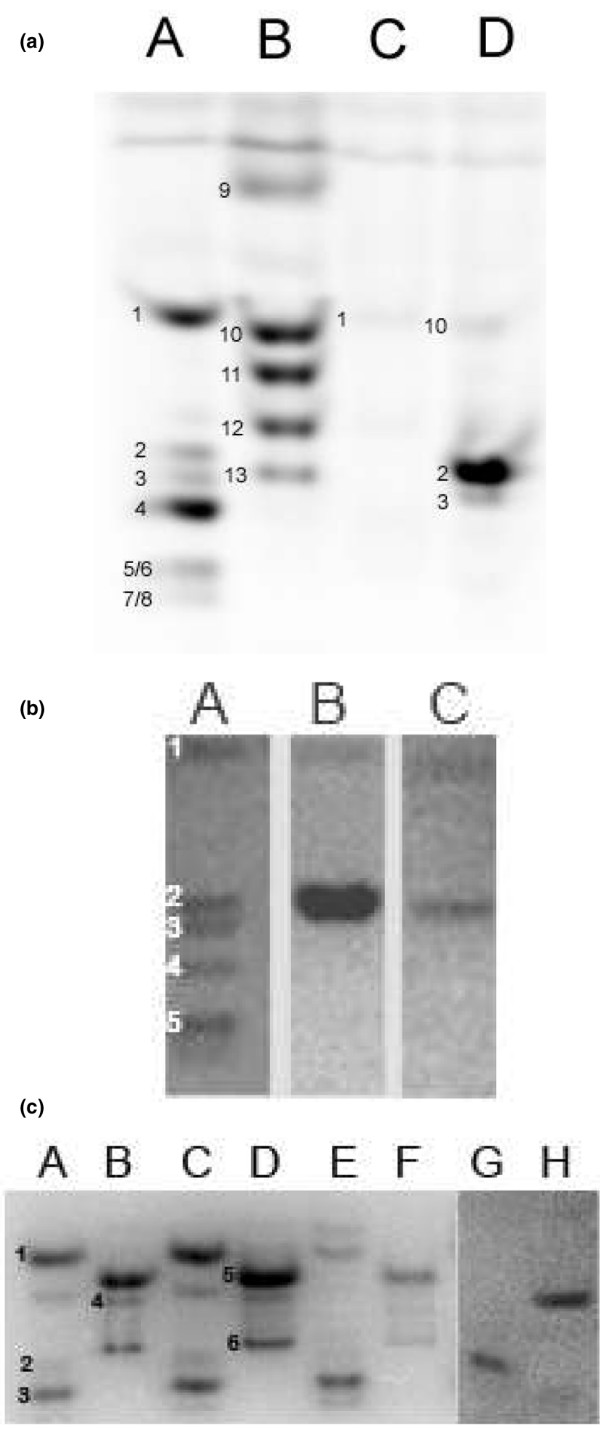
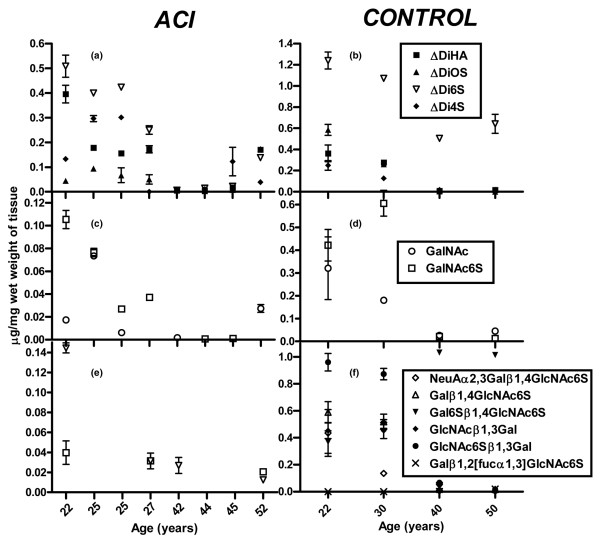
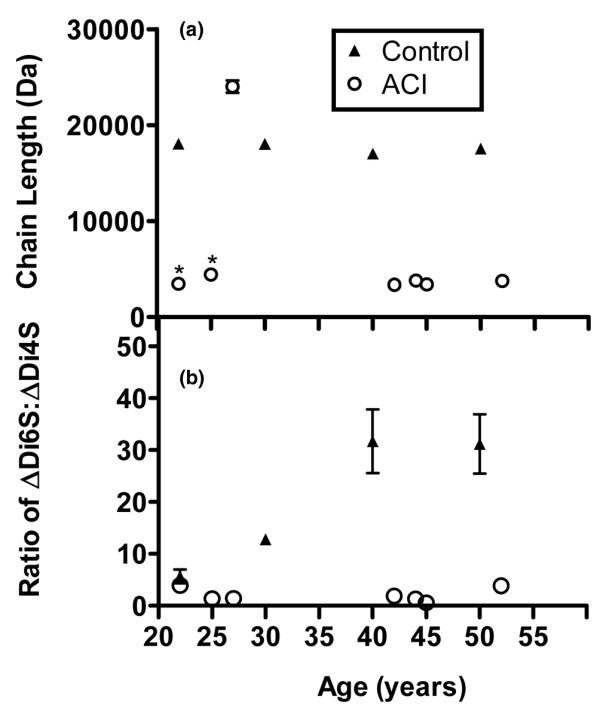
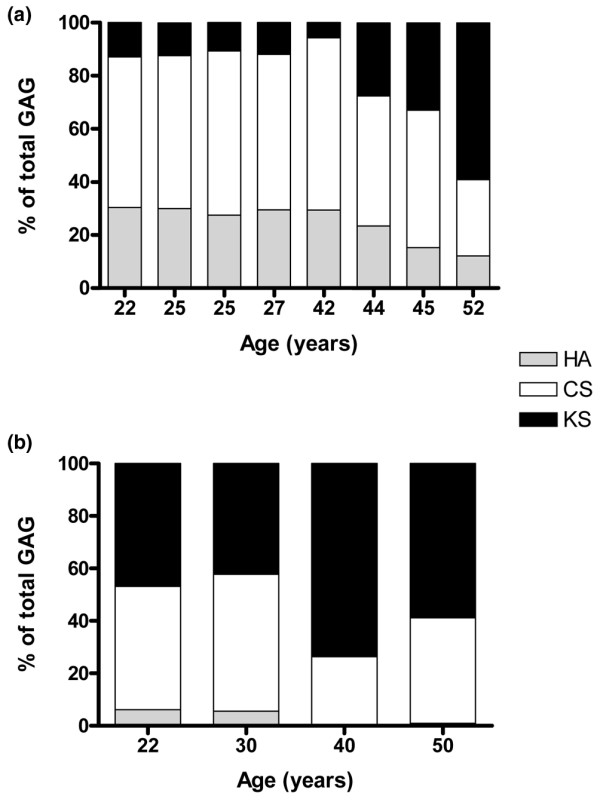
Currently, autologous chondrocyte implantation (ACI) is the most commonly used cell-based therapy for the treatment of isolated femoral condyle lesions of the knee. A small number of centres performing ACI have reported encouraging long-term clinical results, but there is currently a lack of quantitative and qualitative biochemical data regarding the nature of the repair tissue. Glycosaminoglycan (GAG) structure influences physiological function and is likely to be important in the long-term stability of the repair tissue. The objective of this study was to use fluorophore-assisted carbohydrate electrophoresis (FACE) to both quantitatively and qualitatively analyse the GAG composition of repair tissue biopsies and compare them with age-matched cadaveric controls. We used immunohistochemistry to provide a baseline reference for comparison. Biopsies were taken from eight patients (22 to 52 years old) 1 year after ACI treatment and from four cadavers (20 to 50 years old). FACE quantitatively profiled the GAGs in as little as 5 microg of cartilage. The pattern and intensity of immunostaining were generally comparable with the data obtained with FACE. In the ACI repair tissue, there was a twofold reduction in chondroitin sulphate and keratan sulphate compared with age-matched control cartilage. By contrast, there was an increase in hyaluronan with significantly shorter chondroitin sulphate chains and less chondroitin 6-sulphate in repair tissue than control cartilage. The composition of the repair tissue thus is not identical to mature articular cartilage.
Figures
Similar articles
-
A case study: Glycosaminoglycan profiles of autologous chondrocyte implantation (ACI) tissue improve as the tissue matures.Knee. 2017 Jan;24(1):149-157. doi: 10.1016/j.knee.2016.10.002. Epub 2016 Oct 20. Knee. 2017. PMID: 27773574
-
A detailed quantitative outcome measure of glycosaminoglycans in human articular cartilage for cell therapy and tissue engineering strategies.Osteoarthritis Cartilage. 2015 Dec;23(12):2233-2241. doi: 10.1016/j.joca.2015.07.011. Epub 2015 Jul 26. Osteoarthritis Cartilage. 2015. PMID: 26211607
-
[Treatment of deep cartilage defects of the knee with autologous chondrocyte transplantation on a hyaluronic Acid ester scaffolds (Hyalograft C)].Acta Chir Orthop Traumatol Cech. 2006 Aug;73(4):251-63. Acta Chir Orthop Traumatol Cech. 2006. PMID: 17026884 Czech.
-
Strategies for articular cartilage lesion repair and functional restoration.Tissue Eng Part B Rev. 2010 Jun;16(3):305-29. doi: 10.1089/ten.TEB.2009.0590. Tissue Eng Part B Rev. 2010. PMID: 20025455 Review.
-
Articular cartilage repair in the adolescent athlete: is autologous chondrocyte implantation the answer?Clin J Sport Med. 2006 Nov;16(6):465-70. doi: 10.1097/01.jsm.0000248842.93755.e2. Clin J Sport Med. 2006. PMID: 17119359 Review.
Cited by
-
Autologous chondrocyte implantation to repair knee cartilage injury: ultrastructural evaluation at 2 years and long-term follow-up including muscle strength measurements.Knee Surg Sports Traumatol Arthrosc. 2009 Nov;17(11):1278-88. doi: 10.1007/s00167-009-0854-5. Epub 2009 Jul 2. Knee Surg Sports Traumatol Arthrosc. 2009. PMID: 19572120
-
Mechanotransducive Biomimetic Systems for Chondrogenic Differentiation In Vitro.Int J Mol Sci. 2021 Sep 7;22(18):9690. doi: 10.3390/ijms22189690. Int J Mol Sci. 2021. PMID: 34575847 Free PMC article. Review.
-
Mechanisms and Pharmaceutical Action of Lipid Nanoformulation of Natural Bioactive Compounds as Efficient Delivery Systems in the Therapy of Osteoarthritis.Pharmaceutics. 2021 Jul 21;13(8):1108. doi: 10.3390/pharmaceutics13081108. Pharmaceutics. 2021. PMID: 34452068 Free PMC article. Review.
-
Induction of superficial zone protein (SZP)/lubricin/PRG 4 in muscle-derived mesenchymal stem/progenitor cells by transforming growth factor-β1 and bone morphogenetic protein-7.Arthritis Res Ther. 2012 Apr 10;14(2):R72. doi: 10.1186/ar3793. Arthritis Res Ther. 2012. PMID: 22490392 Free PMC article.
-
Failed cartilage repair for early osteoarthritis defects: a biochemical, histological and immunohistochemical analysis of the repair tissue after treatment with marrow-stimulation techniques.Knee Surg Sports Traumatol Arthrosc. 2012 Nov;20(11):2315-24. doi: 10.1007/s00167-011-1853-x. Epub 2012 Jan 6. Knee Surg Sports Traumatol Arthrosc. 2012. PMID: 22222614
References
Publication types
MeSH terms
Substances
LinkOut - more resources
Full Text Sources
