

Identification of human pathogens isolated from blood using microarray hybridisation and signal pattern recognition
- PMID: 17697354
- PMCID: PMC1994958
- DOI: 10.1186/1471-2180-7-78
Identification of human pathogens isolated from blood using microarray hybridisation and signal pattern recognition
Abstract
Background: Pathogen identification in clinical routine is based on the cultivation of microbes with subsequent morphological and physiological characterisation lasting at least 24 hours. However, early and accurate identification is a crucial requisite for fast and optimally targeted antimicrobial treatment. Molecular biology based techniques allow fast identification, however discrimination of very closely related species remains still difficult.
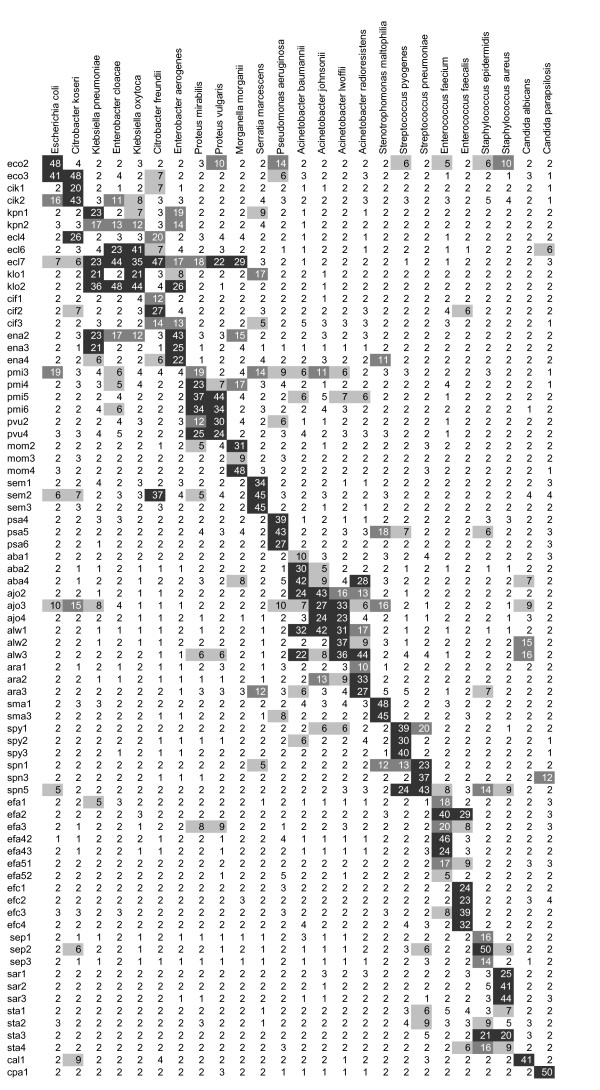
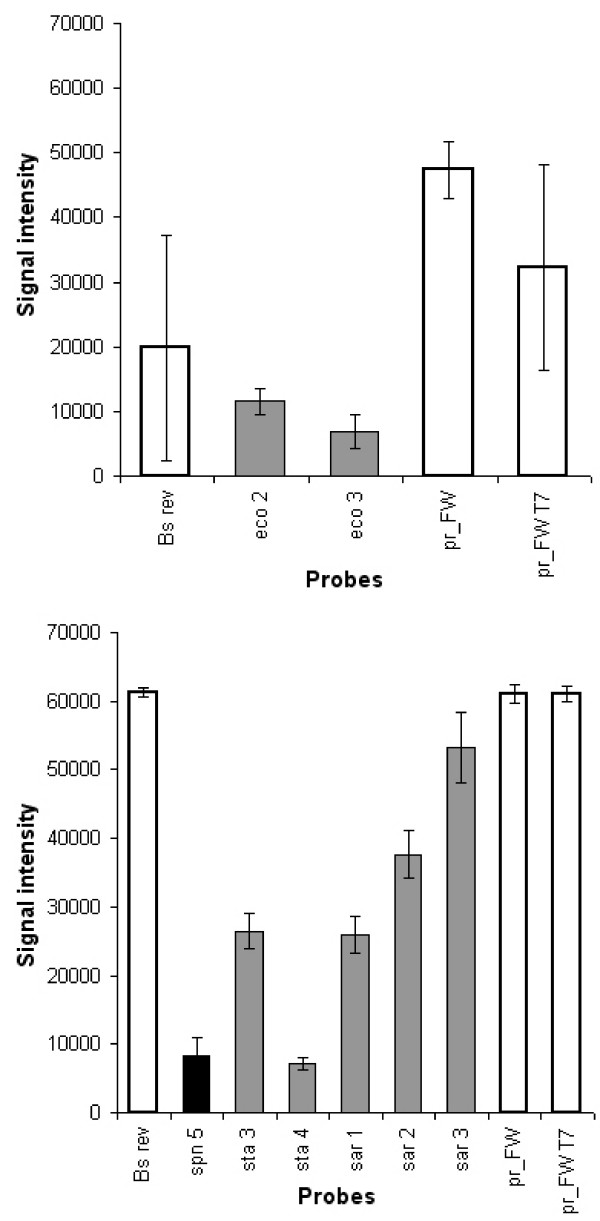
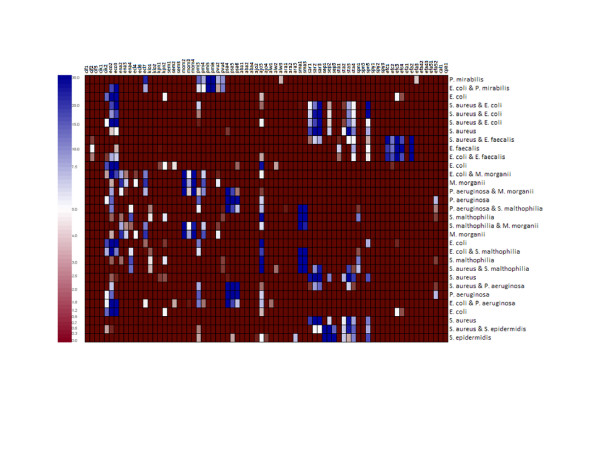
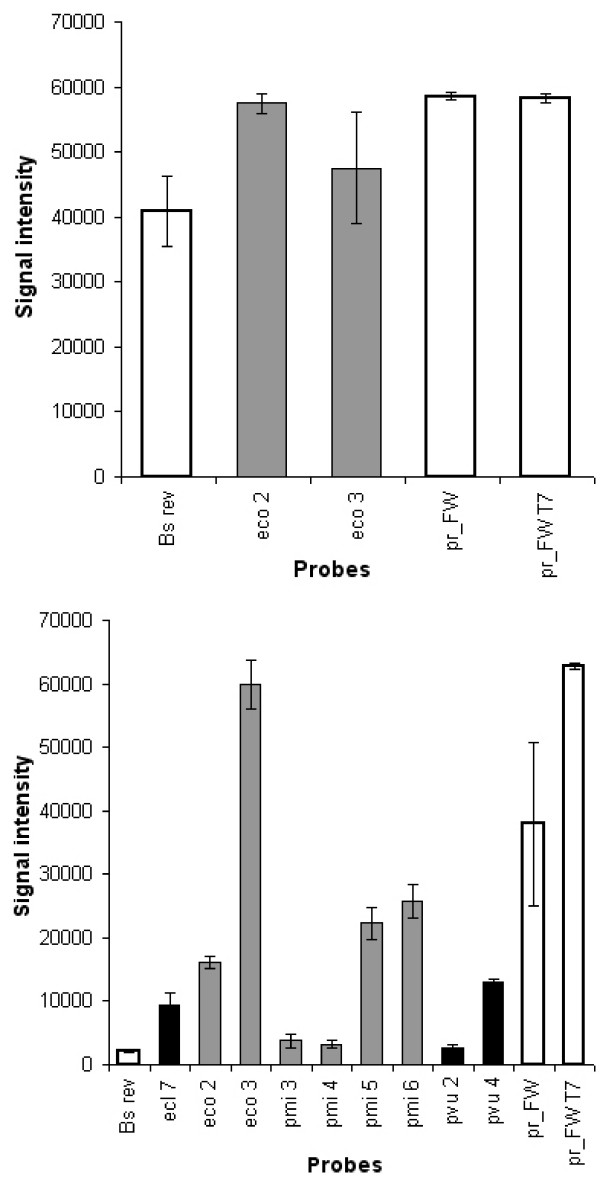
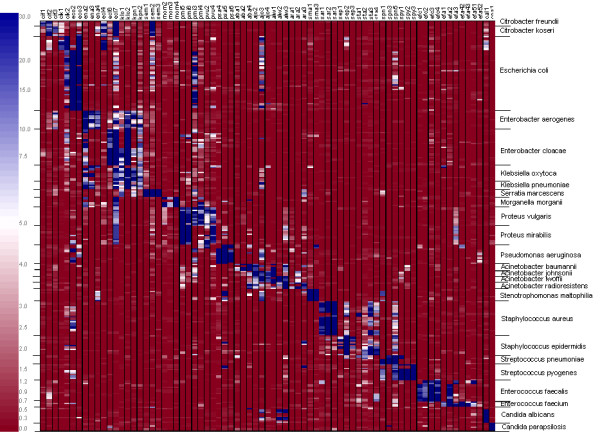
Results: A molecular approach is presented for the rapid identification of pathogens combining PCR amplification with microarray detection. The DNA chip comprises oligonucleotide capture probes for 25 different pathogens including Gram positive cocci, the most frequently encountered genera of Enterobacteriaceae, non-fermenter and clinical relevant Candida species. The observed detection limits varied from 10 cells (e.g. E. coli) to 10(5) cells (S. aureus) per mL artificially spiked blood. Thus the current low sensitivity for some species still represents a barrier for clinical application. Successful discrimination of closely related species was achieved by a signal pattern recognition approach based on the k-nearest-neighbour method. A prototype software providing this statistical evaluation was developed, allowing correct identification in 100 % of the cases at the genus and in 96.7 % at the species level (n = 241).
Conclusion: The newly developed molecular assay can be carried out within 6 hours in a research laboratory from pathogen isolation to species identification. From our results we conclude that DNA microarrays can be a useful tool for rapid identification of closely related pathogens particularly when the protocols are adapted to the special clinical scenarios.
Figures
Similar articles
-
Identification and characterization of bacterial pathogens causing bloodstream infections by DNA microarray.J Clin Microbiol. 2006 Jul;44(7):2389-97. doi: 10.1128/JCM.02291-05. J Clin Microbiol. 2006. PMID: 16825354 Free PMC article.
-
Rapid detection of pathogens in blood culture bottles by real-time PCR in conjunction with the pre-analytic tool MolYsis.J Infect. 2008 Oct;57(4):307-16. doi: 10.1016/j.jinf.2008.07.013. Epub 2008 Aug 29. J Infect. 2008. PMID: 18760842
-
Development of a base stacking hybridization-based microarray method for rapid identification of clinical isolates.Diagn Microbiol Infect Dis. 2007 Oct;59(2):149-56. doi: 10.1016/j.diagmicrobio.2007.05.001. Epub 2007 Jul 26. Diagn Microbiol Infect Dis. 2007. PMID: 17662562
-
Identification of Candida species in the clinical laboratory: a review of conventional, commercial, and molecular techniques.Oral Dis. 2014 May;20(4):329-44. doi: 10.1111/odi.12123. Epub 2013 May 16. Oral Dis. 2014. PMID: 23679136 Review.
-
New developments in the diagnosis of bloodstream infections.Lancet Infect Dis. 2004 Dec;4(12):751-60. doi: 10.1016/S1473-3099(04)01205-8. Lancet Infect Dis. 2004. PMID: 15567125 Review.
Cited by
-
Simple PCR-based DNA microarray system to identify human pathogenic fungi in skin.J Clin Microbiol. 2010 Jul;48(7):2357-64. doi: 10.1128/JCM.02185-09. Epub 2010 Apr 26. J Clin Microbiol. 2010. PMID: 20421438 Free PMC article.
-
Nonparametric methods for the analysis of single-color pathogen microarrays.BMC Bioinformatics. 2010 Jun 28;11:354. doi: 10.1186/1471-2105-11-354. BMC Bioinformatics. 2010. PMID: 20584331 Free PMC article.
-
Development and evaluation of oligonucleotide chip based on the 16S-23S rRNA gene spacer region for detection of pathogenic microorganisms associated with sepsis.J Clin Microbiol. 2010 May;48(5):1578-83. doi: 10.1128/JCM.01130-09. Epub 2010 Mar 17. J Clin Microbiol. 2010. PMID: 20237100 Free PMC article.
-
Analysis of methanotroph community composition using a pmoA-based microbial diagnostic microarray.Nat Protoc. 2011 May;6(5):609-24. doi: 10.1038/nprot.2010.191. Epub 2011 Apr 14. Nat Protoc. 2011. PMID: 21527919
-
Detection of blood-transmissible agents: can screening be miniaturized?Transfusion. 2010 Sep;50(9):2032-45. doi: 10.1111/j.1537-2995.2010.02678.x. Transfusion. 2010. PMID: 20546202 Free PMC article. Review.
References
Publication types
MeSH terms
Substances
LinkOut - more resources
Full Text Sources
Other Literature Sources
Medical
Molecular Biology Databases
