. 2007 Aug 15:8:278.
doi: 10.1186/1471-2164-8-278.

Validation of rice genome sequence by optical mapping

Affiliations

Validation of rice genome sequence by optical mapping

Shiguo Zhou et al. BMC Genomics. .

Abstract

Background: Rice feeds much of the world, and possesses the simplest genome analyzed to date within the grass family, making it an economically relevant model system for other cereal crops. Although the rice genome is sequenced, validation and gap closing efforts require purely independent means for accurate finishing of sequence build data.

Results: To facilitate ongoing sequencing finishing and validation efforts, we have constructed a whole-genome SwaI optical restriction map of the rice genome. The physical map consists of 14 contigs, covering 12 chromosomes, with a total genome size of 382.17 Mb; this value is about 11% smaller than original estimates. 9 of the 14 optical map contigs are without gaps, covering chromosomes 1, 2, 3, 4, 5, 7, 8 10, and 12 in their entirety - including centromeres and telomeres. Alignments between optical and in silico restriction maps constructed from IRGSP (International Rice Genome Sequencing Project) and TIGR (The Institute for Genomic Research) genome sequence sources are comprehensive and informative, evidenced by map coverage across virtually all published gaps, discovery of new ones, and characterization of sequence misassemblies; all totalling ~14 Mb. Furthermore, since optical maps are ordered restriction maps, identified discordances are pinpointed on a reliable physical scaffold providing an independent resource for closure of gaps and rectification of misassemblies.

Conclusion: Analysis of sequence and optical mapping data effectively validates genome sequence assemblies constructed from large, repeat-rich genomes. Given this conclusion we envision new applications of such single molecule analysis that will merge advantages offered by high-resolution optical maps with inexpensive, but short sequence reads generated by emerging sequencing platforms. Lastly, map construction techniques presented here points the way to new types of comparative genome analysis that would focus on discernment of structural differences revealed by optical maps constructed from a broad range of rice subspecies and varieties.


Figures
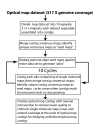
Figure 1
Figure 1
Flow chart showing the strategy used for the assembly of optical maps.
Figure 2
Figure 2
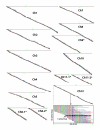
A whole-genome optical map of rice (Oryza sativa ssp. japonica cv. Nipponbare). The 14 optical map contigs are displayed as horizontal lines representing consensus maps; their centromeric regions located by green boxes and partial boxes indicate incomplete centromeric coverage. A consensus map comprises many (29,512 maps; 14 contigs) individual restriction maps, each constructed from one (~470 kb) endonuclease digested molecule shown overlapping other molecules along the accompanying diagonal track. Chromosomes marked with an "*" indicate partial optical map contigs. Inset shows a zoomed view of a ~400 kb interval on chromosome 12 (28.19 Mb). Here, each horizontal track depicts an optical map; its "daughter" restriction fragments are consecutive colored bars and congruent fragments across separate optical maps are color-keyed. Since restriction digestion is not quantitative, some bars (restriction fragments) bear missing or false cleavage sites – relative to the consensus map – flagged by disparate colors.
Figure 4
Figure 4
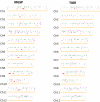
Whole genome view showing optical map vs. IRGSP or TIGR sequence data (pseudomolecules) – identification of errors and their loci (Additional file 1 and 2). 6 tracks depict data and comparison for each of the rice chromosomes (1–12): track 1 (gold solid horizontal line), in silico SwaI maps of the pseudomolecule data; track 2 (grey bars), false cut – cut present in optical map, but absent in sequence data; track 3 (red bars), gaps present in sequence but filled by optical maps; track 4 (blue bars), sequence misassemblies; track 5 (green bars), missing cut – cut present in sequence, but absent in map data; track 6 (magenta bars), new gaps called within the sequence pseudomolecule by optical maps (Table 2 and 3).
Figure 3
Figure 3
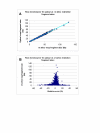
SwaI optical maps of chromosome 10 vs. IRGSP sequence pseudomolecule data. A: plot of sizing error: optical map fragments vs. in silico map fragment from well-aligned regions. The error bars represent the SD of optical map fragment sizes on the calculated means. B: plot of the relative error of optical fragment size vs. in silico map fragments derived from sequence data.
Figure 5
Figure 5
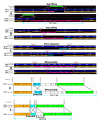
Examples of gap filing, gap calling and sequence assembly discordances detected by alignments between in silico (pseudomolecule sequence) and optical maps. Panels A-D show types of discordances revealed through alignment of optical maps with in silico restriction maps from IRGSPBuild4 and TIGRBuild4 pseudomolecules; red arrows show their basepair locations, and green bars highlight the size of reported gaps in pseudomolecules. Aligned in silico (blue) and optical maps (gold) are shown as tracks comprising individual restriction fragments drawn as numbered bars whose length scales with size (kb). Identified discordances are annotated by color-keyed bars describing restriction map features presented by optical maps, but not found within corresponding in silico restriction maps: magenta = consecutive restriction fragments; red = restriction cut site(s); turquoise = missing restriction site(s). A: The top panel (IRGSPBuild4 Ch01, 10,043,782 – 10,107,330 bp) shows an overestimated sequence gap (green bar; 50.0 kb vs. optical map = 13.10 kb + 12.22 kb); bottom panel (IRGSPBuild4 Ch10, 3,968,375 – 4,068,843 bp), an underestimated gap (green bar; 100.468 kb vs. 26 optical restriction fragments = 507.18 kb, arrow). B: Discovered gaps in pseudomolecules: IRGSPBuild4 Ch08 (3,241,575 bp; 0.41 kb + 30.07 kb) and TIGRBuild4 Ch11 (27,515,267 bp; 2.65 kb + 47.26 kb). C: Extra sequence: IRGSPBuild4 Ch10 (14,828,584 – 14,978,980 bp, 150.396 kb vs. 48.36 kb, turquoise bar); TIGRBuild4 Ch11 (19,298,056 – 19,328,366 bp, 30.310 kb vs. 11.65 kb, turquoise bar). D: Misassembly: IRGSPBuild4 Ch04 (12,428,850 – 12,585,538 bp) vs. a stretch of 11 unaligned optical restriction fragments; TIGRBuild4 Ch04 (15,179,265 – 15,246,346 bp) vs. 5 unaligned restriction fragments. Panels E and F show examples of large-scale misassembly of sequence. In silico and optical maps are horizontal tracks comprising restriction fragments demarcated by vertical lines with aligned portions color-keyed and indicated by connecting lines; unaligned restriction fragments are white. E: IRGSPBulid4 Ch11 (29,945,713 – 30,823,503 bp; 877.790 kb) shows an 89.796 kb inversion (blue) and two significant portions (18.121 kb, 202.752 kb; white) unaligned to the optical map. F: IRGSPBuild4 & TIGRBuild4 Ch11 (18,181,576 – 18,600,983 bp; 419.407 kb & 15,853,410 – 16,272,766 bp; 419.356 kb, blue lettering for TIGRBuild4) show a 39.334 kb inversion (blue), a small insertion and portion (18,356,214 – 18,365,879 bp) missing a possible repetitive region characterized by the optical map.
Figure 6
Figure 6
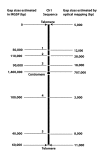
Estimates of chromosome 1 gap sizes by genetic markers or fibre (or pachytene) FISH, vs. optical mapping results. Diagram shows gaps (spaces between contigs), and sizes estimates among the 7 sequence contigs.

References

    1. Green ED. Strategies for the systematic sequencing of complex genomes. Nat Rev Genet. 2001;2:573–583. doi: 10.1038/35084503. - DOI - PubMed
    1. Shendure J, Porreca GJ, Reppas NB, Lin X, McCutcheon JP, Rosenbaum AM, Wang MD, Zhang K, Mitra RD, Church GM. Accurate multiplex polony sequencing of an evolved bacterial genome. Science. 2005;309:1728–1732. doi: 10.1126/science.1117389. - DOI - PubMed
    1. Margulies M, Egholm M, Altman WE, Attiya S, Bader JS, Bemben LA, Berka J, Braverman MS, Chen YJ, Chen Z, et al. Genome sequencing in microfabricated high-density picolitre reactors. Nature. 2005;437:376–380. - PMC - PubMed
    1. Wing RA, Ammiraju JS, Luo M, Kim H, Yu Y, Kudrna D, Goicoechea JL, Wang W, Nelson W, Rao K, et al. The oryza map alignment project: the golden path to unlocking the genetic potential of wild rice species. Plant Mol Biol. 2005;59:53–62. doi: 10.1007/s11103-004-6237-x. - DOI - PubMed
    1. Soderlund C, Longden I, Mott R. FPC: a system for building contigs from restriction fingerprinted clones. Comput Appl Biosci. 1997;13:523–535. - PubMed

Publication types

LinkOut - more resources