. 2007 Sep 15;309(2):193-207.
doi: 10.1016/j.ydbio.2007.06.018. Epub 2007 Jun 29.

Mechanisms of palatal epithelial seam disintegration by transforming growth factor (TGF) beta3

Affiliations

Mechanisms of palatal epithelial seam disintegration by transforming growth factor (TGF) beta3

Shaheen Ahmed et al. Dev Biol. .

Abstract

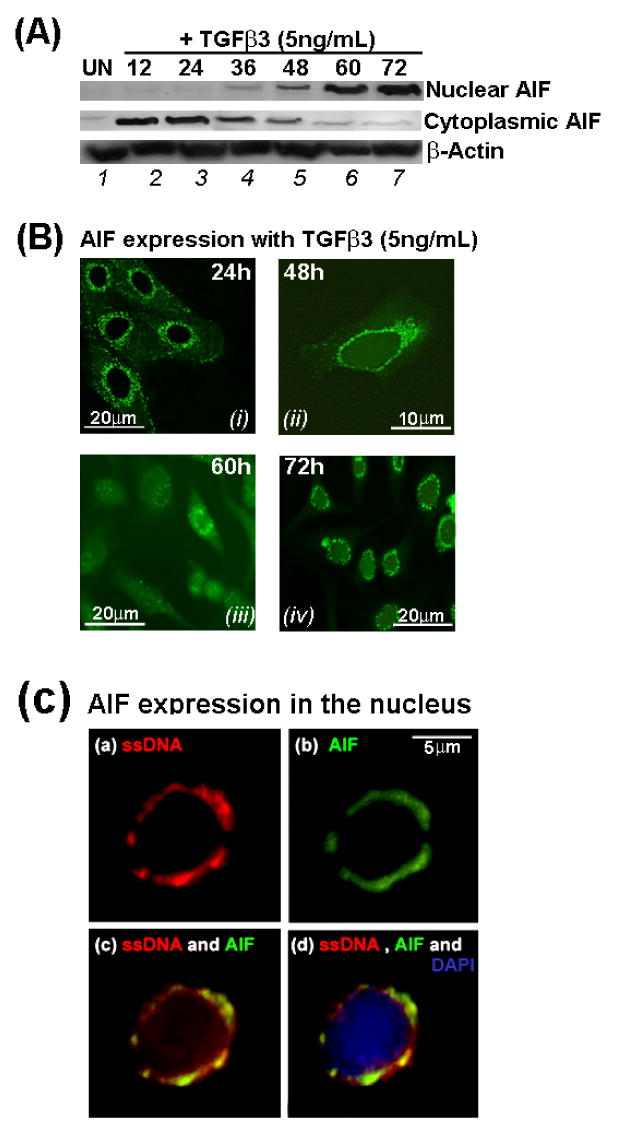
TGFbeta3 signaling initiates and completes sequential phases of cellular differentiation that is required for complete disintegration of the palatal medial edge seam, that progresses between 14 and 17 embryonic days in the murine system, which is necessary in establishing confluence of the palatal stroma. Understanding the cellular mechanism of palatal MES disintegration in response to TGFbeta3 signaling will result in new approaches to defining the causes of cleft palate and other facial clefts that may result from failure of seam disintegration. We have isolated MES primary cells to study the details of MES disintegration mechanism by TGFbeta3 during palate development using several biochemical and genetic approaches. Our results demonstrate a novel mechanism of MES disintegration where MES, independently yet sequentially, undergoes cell cycle arrest, cell migration and apoptosis to generate immaculate palatal confluency during palatogenesis in response to robust TGFbeta3 signaling. The results contribute to a missing fundamental element to our base knowledge of the diverse roles of TGFbeta3 in functional and morphological changes that MES undergo during palatal seam disintegration. We believe that our findings will lead to more effective treatment of facial clefting.


Figures

Fig. 1
Fig. 1. Stages of normal palate development
Single palatal shelves collected from 14dpc CF1 mouse embryos were placed together with the corresponding opposite palatal shelf and incubated in organ culture in the presence of exogenous recombinant TGFβ3 (5ng/mL) for up to 72 hours (added every 24 hours). They were collected at 12, 24, 36, 48, 60 and 72 hours of culture and stained with hematoxylin and eosin (H&E). Palatal shelves adhered to form the MES by 12 hours (A, white arrow). At 24 hours, the seam began to separate into small islands of epithelial cells (B). By 48 hours, a few MES cells remained (C). By 72 hours, the seam completely disintegrated and palatal confluency was complete (D, blue arrow). However, when the single palatal shelves were treated with TGFβ3-blocking antibody (5ng/ml), seam remained intact as late as 72 hours (E, white arrow), and when apoptosis were blocked with pan Caspase inhibitor, zVAD-fmk (20μM), remnant of the MES cells were still present at the oro-palatine and naso-palatine triangle and fusion was incomplete (F, white arrow). Single palates were treated with the inhibitors for 24 hours to have their effect before the shelves were placed together to form a seam. Each bar value, as stated, represents the size and magnification of the image.
Fig. 2
Fig. 2. Collection of primary MES cell
Palate medial edge epithelial cells from CF-1 mouse (Charles River Laboratories) embryos were separated from underlying mesenchyme using Dispase II (Roche), from palatal shelves adhered for 12 hours in organ culture, as previously described in Nawshad et al., (2007) (A). Cells were then cultured into primary cell lines in DMEM + 10% FBS + 1% penicillin/streptomycin (B). Following confirmation of the clonal homogeneity of the MES epithelial cells (see material and methods for detail) and that they derive from single clone devoid of any mesenchymal contamination, MES cells were stained for the expression of epithelial markers such as E-cadherin (C, arrow), Desmoplakin (D, arrow) and Desmoglein (E, arrow) to demonstrate that isolated cells maintained fully and only epithelial characteristics. Cells were treated with exogenous recombinant TGFβ3 (5ng/mL) every 24 hours and all experiments were performed in triplicate. Each bar value, as stated, represents the size and magnification of the image.
Fig. 3
Fig. 3. TGFβ3 induces MES migration followed by apoptosis
80% confluent MES cells were treated with TGFβ3 (5ng/mL) every 24 hours for 72 hours. MES cells showed gradual phenotypical changes from adhered epithelial (A) to fully motile and migratory fibroblastoid at 48 hours (B) but began to die at 60 hours (black arrow) as apoptotic bodies began to appear (C) and apoptosis continued to increase at 72 hours (D). When apoptosis was blocked with zVAD-fmk, MES cells continued to migrate (E-H). In the presence of TGFβ3, MES cells underwent migratory changes (J), and the cells remained migratory even after TGFβ3 signaling was blocked with blocking TGFβ3 antibody (K, L). Bar value (50μm) represents the size and magnification of the image.
Fig. 4
Fig. 4. E-cadherin is reduced in response to TGFβ3
MES cells were grown to 80% confluence as described in Fig. 3. Untreated MES showed membrane localization of E-cadherin (A). E-cadherin was significantly reduced when the cells were treated with TGFβ3 for 24 hours (B). MES cells were stained with fluorescence (A, B) conjugated antibody against E-cadherin and counter stained with DAPI. At 48 hours, when MES cells become migratory as a results of reduced cell-cell adhesion E-cadherin, migratory MES cells expressed Fibronectin (C, Alexa Fluor 488), Vimentin (D, Alexa Fluor 594) and α-SMA (F, Alexa Fluor 350) (merged all proteins in E). Each bar value, as stated, represents the size and magnification of the image.
Fig. 5
Fig. 5. MES cells with increased E-cadherin do not migrate
Confluent MES cells were transiently infected with GFP-retrovirus encoding full length E-cadherin cDNA as well as control GFP without the E-cadherin cDNA (A, B). Infection rate was high (C, D) for both the constructs. Transduced MES cells expressed GFP within 48 hours. We used Scratch wound assays (G, H and I-K) to morphologically assess the migratory phenotype and evaluate the cell motility. MES cells were treated with TGFβ3 (5ng/mL). After 48 hours, only the GFP-control cells were motile and migrated into the gap (F, H - phase contrast). But MES cells expressing high E-cadherin failed to migrate and remained epithelial (E, G - phase contrast). TGFβ3 promotes cell migration and motility independent of apoptosis: Our results also showed lack of cell migration in untreated (control) MES cells (I). MES cells treated with TGFβ3 (5ng/mL) become motile (J). Blocking apoptosis with zVAD-fmk, had no significant role in MES cell migration and motility (L, K). (mean ± SD; n=3; p<0.05; RFU- Relative Fluorescence Unit). Transwell cell migration assay results were compared with Scratch wound assay and were found to be in accord as cell migration was also induced upon TGFβ3 and transiently infected with GFP-retrovirus encoding full length E-cadherin cDNA can inhibit cell migration, whereas inhibiting apoptosis with zVAD-fmk has limited or no effect on migration (L). Each bar value, as stated, represents the size and magnification of the image.
Fig. 6
Fig. 6. MES cells undergo TGFβ3 induced cell cycle arrest
MES cells grown in culture were treated with Aphidicolin (6μM) for 16 hours, which blocks DNA synthesis to synchronize all MES cells at G1 phase (A). Once synchronized, MES cells were released from the block for 30 mins., treated with TGFβ3 (5ng/mL) added every 24 hours for 3 days, collected every 12 hours of treatment, fixed with 70% ethanol (−20°C) and FACSArray was done to evaluate cell cycle status. MES cells treated with TGFβ3 failed to advance to the next phases (S, G2 and M) and remained stagnant at G1. MES cells began to die and showed apoptosis as early as 24 hours gradually reaching to 23% by 72 hours without undergoing any cell cycle progression (B-F). In contrast, TGFβ3 untreated cell (control), twice progress through all phases of cell cycle (bottom panel, G-L).
Fig. 7
Fig. 7. TGFβ3 promotes MES cell to undergo apoptosis
MES cells grown in culture to 80% confluency were treated with TGFβ3. Nucleic acid dyes, C12-resazurin at 488nm and Sytox Red at 633nm excitation show “Live” (P2) and “dead” (P1) cells, respectively. The figures show cell cycle arrested cells in pink (P4) and debris in blue (P3). Within 12 hours of TGFβ3 treatment, MES cells began to cease proliferating and undergo cell cycle arrest (P4) and the number of cell cycle arrested MES cells continued to increase over time. Dead cells (P1) began to appear at 60 hours of treatment and by 72 hours, the number of “dead cells” reached nearly 33% of the total MES cells with the remaining being “dying” cells. Untreated control cell (bottom panel), in contrast, remain live and viable (P2) as late as 72 hours.
Fig. 8
Fig. 8. Apoptosis during MES disintegration
Mouse palates from 17dpc embryos showed TUNEL positive cells in the developing palates. Double immunofluorescences labeled TUNEL-FITC positive apoptotic cells were present at the remnants of epithelial cells of the oral-palatine triangular regions in near confluent palate (A, arrow). Rhodamine conjugated E-cadherin antibody was used to demarcate MES for accurate localization of the apoptotic cells. Biotin/Streptavidin-HRP/DAB labeled TUNEL positive remaining apoptotic MES cells were seen in the naso-palatine triangle (B). In MES cell culture, TUNEL positive cells (Biotin/Streptavidin-HRP/DAB labeled) are only seen 72 hours after TGFβ3 (5ng/mL) treatment (D, arrow). No TUNEL positive cells were seen in the untreated cells (C). MES cells were counter stained with H&E for detailed morphology (C, D).
Fig. 9
Fig. 9. Cell cycle arrest and apoptosis markers induced by TGFβ3
Upon TGFβ3 treatment, Protein expression of the cell cycle arrest markers p15, p21 and p27 gradually increased from 12 hours to strong expression at 72 hours with no cell proliferation maeker, PCNA expression (A), Caspase 9 and 3 showed gradually increased expression from 36 to 72 hours (B). In response to TGFβ3, MES cells showed higher expression cleaved Caspase 3 (17 and 19 kDa) at 60 and 72 hours compared to earlier time points (C). Anti-apoptotic BCL-2 and pro-apoptotic Bax protein expression was inversely proportional. BCL-2 showed high expression at 24 hours of TGFβ3 treatment but gradually decreased. Bax on the contrary showed very limited expression until 48 hours with increased expression at 72 hours (D). All untreated control (UN) experiments were done using the same method as treated but the results shown are from 48 hours as this is the time point when all proteins are expressed mostly. (A, B, C and D).
Fig. 10
Fig. 10. MES cells undergo DNA fragmentation during apoptosis
MES cells in culture undergo both High Molecular Weight, (HMW) −47kbp (A) and Low Molecular Weight (LMW) 100-700bp (C) DNA fragmentation in response to TGFβ3 that occurs in a time dependent manner at 60 and 72 hours respectively. And they are also dose sensitive as higher concentrations of exogenous TGFβ3 induce a higher degree of fragmentation (B, D). All untreated control (UN) experiments were done using the same method as treated but without TGFβ3 addition and the results from only 72 hours are shown in the figures.
Fig. 11
Fig. 11. Apoptotic Inducing Factor, AIF protein expression and its nuclear localization
In response to TGFβ3 signaling, AIF protein expression remained cytoplasmic in the MES cells in the first 36 hours of TGFβ3 treatment (A, lanes 2, 3 and 4) and gradually the protein translocated into the nucleus showing low expression of AIF protein the nucleus beginning at 36 hours (lane 4) and expression gradually increased (lanes 4, 5) and reach a peak by 60 hours (A, lanes 6, 7). Similarly, exact localization of AIF protein expression was confirmed by immunofluoroscene and in accord with immunoblot results, immunofluoroscene results also showed punctate mitochondrial AIF expression at 24 (B, i) and 48 hours (B, ii). AIF protein gradually diffused in the cytoplasm translocated into the nucleus (60 hours, B, iii) and eventually showed complete nuclear by 72 hours (B, iv) expression in the MES cells. Additionally, MES cells at 60 hours showed increased AIF expression recognized by fluorescein conjugated anti-AIF monoclonal antibody in the nucleus (C, b and c) which co-localized with Rhodamine-conjugated anti single stranded (ss) DNA monoclonal antibody (C, a and c) and nucleus was stained with DAPI (C, d). Each bar value, as stated, represents the size and magnification of the image.

Similar articles

Cited by

References

    1. Arnoult D, Parone P, Martinou JC, Antonsson B, Estaquier J, Ameisen JC. Mitochondrial release of apoptosis-inducing factor occurs downstream of cytochrome c release in response to several proapoptotic stimuli. J Cell Biol. 2002;159:923–9. - PMC - PubMed
    1. Bahi N, Zhang J, Llovera M, Ballester M, Comella JX, Sanchis D. Switch from caspase-dependent to caspase-independent death during heart development: essential role of endonuclease G in ischemia-induced DNA processing of differentiated cardiomyocytes. J Biol Chem. 2006;281:22943–52. - PubMed
    1. Boehm M, Nabel EG. Cell cycle and cell migration: new pieces to the puzzle. Circulation. 2001;103:2879–81. - PubMed
    1. Bonneton C, Sibarita JB, Thiery JP. Relationship between cell migration and cell cycle during the initiation of epithelial to fibroblastoid transition. Cell Motil Cytoskeleton. 1999;43:288–95. - PubMed
    1. Boyer AS, Ayerinskas II, Vincent EB, McKinney LA, Weeks DL, Runyan RB. TGFbeta2 and TGFbeta3 have separate and sequential activities during epithelial-mesenchymal cell transformation in the embryonic heart. Dev Biol. 1999;208:530–45. - PubMed

Publication types

LinkOut - more resources