. 2007 Aug;28(7):1292-8.
doi: 10.3174/ajnr.A0539.

Measuring elevated microvascular permeability and predicting hemorrhagic transformation in acute ischemic stroke using first-pass dynamic perfusion CT imaging

Affiliations

Measuring elevated microvascular permeability and predicting hemorrhagic transformation in acute ischemic stroke using first-pass dynamic perfusion CT imaging

K Lin et al. AJNR Am J Neuroradiol. 2007 Aug.

Abstract

Background and purpose: Hemorrhagic transformation (HT) can be a devastating complication of acute ischemic stroke (AIS). The purpose of this study was to determine whether increased microvascular permeability (PS) of the blood-brain barrier was detected in early AIS by using first-pass dynamic perfusion CT (PCT) and whether PS was significantly higher in infarcts destined for HT.

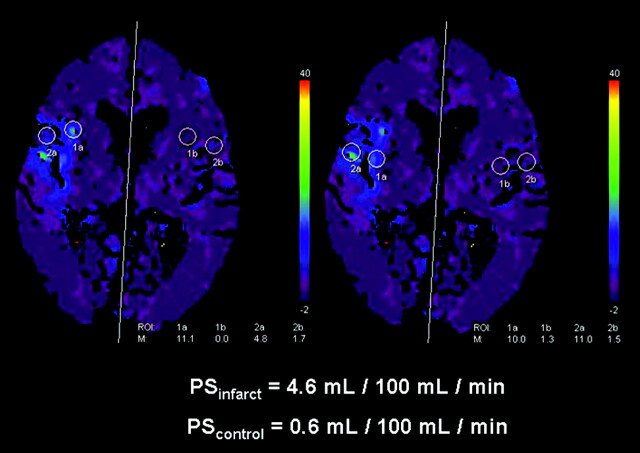
Materials and methods: Fifty patients with AIS less than 3 hours old and evaluated by PCT were included. PS color maps were retrospectively generated from PCT data using the Patlak model. One reader analyzed each PS map by drawing 4 circular 10-mm regions of interest on any focal abnormality. The mean of these 4 regions of interest represented the PS of the infarct (PSinfarct). The mean of 4 mirror regions of interest on the nonischemic contralateral hemisphere was also obtained (PScontrol). PSinfarct and PScontrol were compared by using an exact Wilcoxon test. PSinfarct for infarcts that developed HT on follow-up (PSHT) was compared with all of the others (PSNo-HT) using an exact Mann-Whitney test.

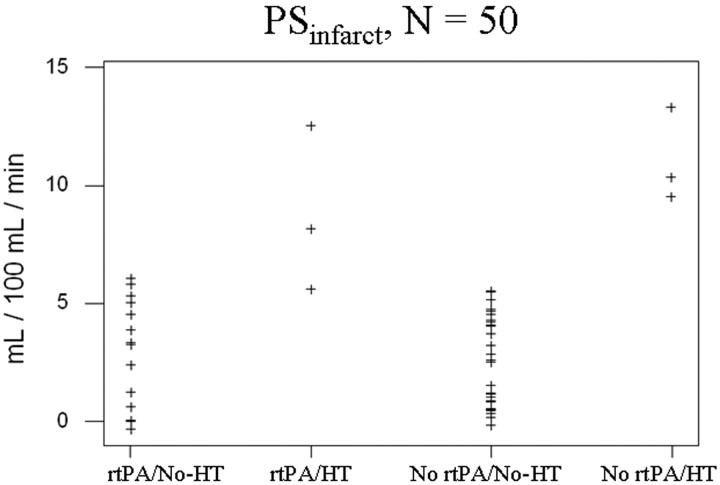
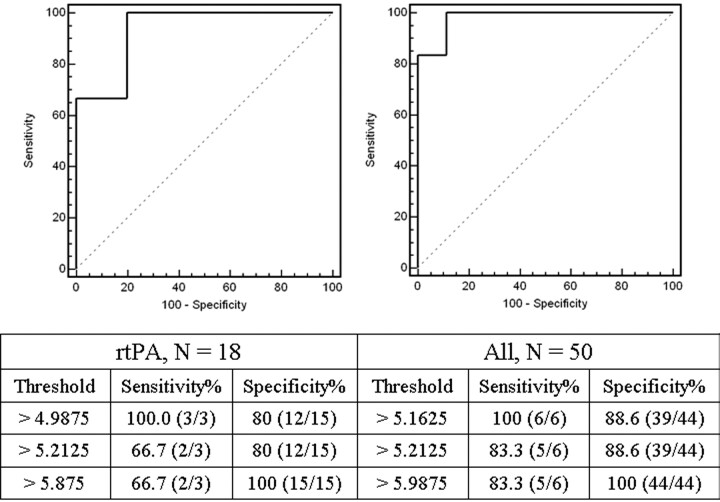
Results: Forty-four infarcts (88%) showed focal PS elevation in the region of infarct. In units of milliliters per 100 milliliters per minute, PSinfarct ranged from 0 to 13 (mean: 3.5+/-3.1) versus PScontrol of 0-0.8 (mean: 0.28+/-0.27; P<.0001). Six infarcts (12%) developed HT, all of which were within the region of PS elevation. PSHT ranged from 5.2 to 13 (mean: 9.8+/-2.9) versus PSNo-HT of 0-5.9 (mean: 2.7+/-2.0; P<.0001). Eighteen infarcts (36%) were treated with recombinant tissue plasminogen activator (rtPA). A significant difference between PSHT and PSNo-HT persisted irrespective of rtPA treatment.

Conclusions: Elevated permeability was detectable in AIS by using first-pass PCT and it predicted subsequent HT.


Figures

Fig 1.
Fig 1.
A map of microvascular PS acquired from first-pass dynamic contrast-enhanced images over 60 seconds. There was a region of PS elevation encompassing the right insula cortex and portions of the right frontal and temporal lobes. CBF, CBV, and TTP maps showed hypoperfusion in these regions (not shown) in this 86-year-old woman with an acute right MCA stroke. Four 10-mm circular regions of interest were placed over the region of PS elevation, as depicted here, to acquire 4 PS measurements that were then averaged to give a single value for statistical analysis (PSinfarct). Mirror regions of interest were automatically placed on the contralateral, nonischemic, homologous hemisphere to provide a control value (PScontrol). Note that the PS values calculated by the application are scaled to 0.5 mL/100 mL per minute. No HT was found on follow-up imaging.
Fig 2.
Fig 2.
A 53-year-old man with complaint of acute left hemiparesis, presented within 3 hours of symptom onset. A, Initial NCCT showed subtle hypoattenuation in the right frontal lobe with loss of gray-white distinction suspicious for AIS. B, C, and D, CBF, CBV, and TTP color maps, respectively, showed hypoperfusion in the right basal ganglia and frontal lobe consistent with right MCA AIS. E, PS color map, from the same raw data used to create the perfusion maps, showed PSinfarct of 8.1 mL/100 mL per minute. Emergent intravenous rtPA was given. F, NCCT 27 hours after initial presentation revealed frank hemorrhage in the region of infarction (PH1). The patient developed acute deterioration of his mental status 1 hour before this CT.
Fig 3.
Fig 3.
A 68-year-old woman with acute mental status changes, presented within 3 hours of symptom onset. A, Initial NCCT showed loss of gray-white distinction in the right insula (insula ribbon sign) suspicious for AIS. B, C, and D, CBF, CBV, and TTP color maps, respectively, showed focal perfusion abnormality in the right insula and frontal lobe consistent with acute right MCA AIS. E, PS color map, from the same raw data used to create the perfusion maps, showed PSinfarct of 13 mL/100 mL per minute. No thrombolytic agent was given. F, NCCT 26 hours after presentation revealed a subtle focus of hyperattenuation in the infarct area. G and H, B0 images from DWI 30 hours after presentation demonstrated foci of signal intensity loss consistent with blood products (HI2).
Fig 4.
Fig 4.
Scatterplot of the 50 PSinfarct values, categorized by whether emergent rtPA was given and whether subsequent HT occurred. Note the separation of PSHT values (second and fourth columns) from those of PSNo-HT (first and third columns).
Fig 5.
Fig 5.
ROC curves for the rtPA-treated subgroup (left) and the entire cohort (right) with the table of threshold PSinfarct criteria (in units of mL/100 mL per minute) used to generate the curves. For the rtPA-treated subgroup and the entire cohort, the AUC was 0.933 and 0.981, respectively. The data in the non-rtPA-treated subgroup produced an ROC curve with AUC of 1.00 (data not shown), because there was complete separation of PSHT and PSNo-HT (Fig 4).

Similar articles

Cited by

References

    1. Axel L. Cerebral blood flow determination by rapid-sequence computed tomography. Radiology 1980;137:679–86 - PubMed
    1. Koenig M, Klotz E, Luka B, et al. Perfusion CT of the brain: diagnostic approach for early detection of ischemic stroke. Radiology 1998;209:85–93 - PubMed
    1. Klotz E, König M. Perfusion measurements of the brain: using dynamic CT for the quantitative assessment of cerebral ischemia in acute stroke. Eur J Radiol 1999;30:170–84 - PubMed
    1. Mayer TE, Hamann GF, Baranczyk J, et al. Dynamic CT perfusion imaging of acute stroke. AJNR Am J Neuroradiol 2000;21:1441–49 - PMC - PubMed
    1. Rother J, Jonetz-Mentzel L, Fiala A, et al. Hemodynamic assessment of acute stroke using dynamic single-slice computed tomographic perfusion imaging. Arch Neurol 2000;57:1161–66 - PubMed

MeSH terms