. 2007 Sep 3;204(9):2103-14.
doi: 10.1084/jem.20062571. Epub 2007 Aug 13.

New markers for murine memory B cells that define mutated and unmutated subsets

Affiliations

New markers for murine memory B cells that define mutated and unmutated subsets

Shannon M Anderson et al. J Exp Med. .

Abstract

The study of murine memory B cells has been limited by small cell numbers and the lack of a definitive marker. We have addressed some of these difficulties with hapten-specific transgenic (Tg) mouse models that yield relatively large numbers of antigen-specific memory B cells upon immunization. Using these models, along with a 5-bromo-2'-deoxyuridine (BrdU) pulse-label strategy, we compared memory cells to their naive precursors in a comprehensive flow cytometric survey, thus revealing several new murine memory B cell markers. Most interestingly, memory cells were phenotypically heterogeneous. Particularly surprising was the finding of an unmutated memory B cell subset identified by the expression of CD80 and CD35. We confirmed these findings in an analogous V region knock-in mouse and/or in non-Tg mice. There also was anatomic heterogeneity, with BrdU(+) memory cells residing not just in the marginal zone, as had been thought, but also in splenic follicles. These studies impact the current understanding of murine memory B cells by identifying new phenotypes and by challenging assumptions about the location and V region mutation status of memory cells. The apparent heterogeneity in the memory compartment implies either different origins and/or different functions, which we discuss.


Figures

Figure 1.
Figure 1.
A greater proportion of memory B cells are CD80+ than naive B cells. (A) Representative FACS plots of alum- and NP-immunized (m+s)Ig spleen cells stained with B220 and NIP-PE (top row) and B220 and anti-BrdU (bottom row) 12 wk after immunization. The plots on the bottom row are gated on the NP+ population from the top row, as indicated by the arrows. For comparisons of cell surface markers, total NP+ B cells from naive mice (gate with dashed line) and NP+/BrdU+ B cells from immune mice (gate with bold line) were used. (B) The level of CD80 on naive NP+ B cells (hatched histogram with thin line) and immune NP+/BrdU+ B cells (darkly shaded histogram with bold line) 8 wk after immunization (representative histogram from three mice per group). (C) FACS plots of alum- and NP-immunized B6 spleen cells gated on CD19+ B cells and stained with NIP-APC and anti-IgG1 15 wk after immunization. The percentage of total NP-binding cells of B cells is shown, as well as the percentage of IgG1+/NP+ cells. (D) The level of CD80 on NP+ B cells from alum controls (hatched histogram with thin line) and NP+/IgG1+ B cells from immune mice (darkly shaded histogram with bold line) 15 wk after immunization (representative histogram from five mice per group).
Figure 2.
Figure 2.
There were several surface markers that exhibited differences between naive and immune NP+ B cells. Markers that were significantly different between naive and memory B cells from (m+s)Ig Tg (A), B1-8 knock-in (B), and B6 mice (C). Total NP+ B cells from alum control mice (hatched histogram with thin line) and NP+/BrdU+ B cells (A) or NP+/IgG1+ B cells (B and C) from immunized mice (darkly shaded histogram with bold line) were compared 16–20 wk after immunization. (D) Markers that were not different, but presented a heterogeneous pattern in both naive and memory NP+ cells from (m+s)Ig mice are shown. Each histogram corresponds to one representative mouse out of three to seven total mice per group.
Figure 3.
Figure 3.
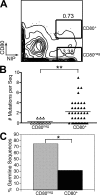
CD80+/NP+ B cells contain most of the mutations found in the V regions of the λ1 gene from immune (m+s)Ig mice. (A) Sort profile from (m+s)Ig mice immunized 24 wk before. Gates were set on NP+/CD80+ and NP+/CD80neg cells based on staining from alum-treated mice, which lacked a significant CD80+ population. (B) Closed triangles represent the number of mutations in individual λ1 genes from the CD80+ population (n = 38), and open triangles represent the number of mutations from the CD80neg population (n = 12). **, P < 0.005, Mann–Whitney test. (C) The percentage of sequences in germline configuration out of the total number of sequences obtained from CD80+ (shaded bar) and CD80neg (hatched bar) NP+ cells. *, P < 0.01, χ2 test.
Figure 4.
Figure 4.
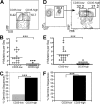
CD35lo/CD80+/NP+ B cells contain most of the mutations found in the V regions of the λ1 gene from immune (m+s)Ig and non-Tg B6 mice. NP+/CD80+ cells were further sorted based on CD35 expression. Shown is the total NP+ B cell population from immune (m+s)Ig Tg (A) or non-Tg B6 splenocytes (D); the CD80+/CD35hi and CD80+/CD35lo gates (with frequencies) used for sorting are shown for each strain. (B and E) Closed diamonds represent the number of mutations in individual λ1 genes from the CD80+/CD35hi population (n = 15 [m+s]Ig Tg; n = 21 B6), and open diamonds represent the number of mutations from the CD80+/CD35lo population (n = 21 [m+s]Ig; n = 19 B6). ***, P < 0.001, Mann–Whitney test. (C and F) The percentage of sequences in germline configuration out of the total number of sequences obtained from CD80+/CD35hi (shaded bar) and CD80+/CD35lo (hatched bar) NP+ cells from both mouse strains. ***, P < 0.001, χ2 test.
Figure 5.
Figure 5.
A loss of unmutated cells 12–24 wk after immunization suggests ongoing selection of the mutated memory compartment. CD80+/NP+ B cells were sorted from (m+s)Ig mice 12 and 24+ wk after immunization. (A) Circles represent the number of mutations in individual λ1 genes from the CD80+ population 12 wk after immunization (n = 42), and triangles represent the number of mutations from the CD80+ population 24+ wk after immunization (n = 38). *, P = 0.04, Mann–Whitney test. (B) The distribution of sequences with the indicated number of mutations is shown. The total number of sequences is shown in the center circle. P < 0.05, χ2 test. (C) The distribution of replacement mutations in either the CDR (black) or FW (white) regions of the Vλ1 at 12 and 24 wk after immunization is shown. ***, P < 0.005, χ2 test.
Figure 6.
Figure 6.
Memory cells are equally distributed among the follicles and MZs of the spleen. Serial sections from a (m+s)Ig spleen 12 wk after immunization were stained with anti–MOMA-1 (blue)/anti–F4-80 (red) (A) and anti-λ(blue)/anti-BrdU (red) (B) Abs. The portion magnified in E is boxed in B. (C) Images of the histochemically stained sections were inverted and false colored in Photoshop, and serial sections were overlaid using architectural landmarks as guides (blue, F4-80; green, MOMA-1; red, λ). (D) The area bounded by the pink lines was measured and used to determine the density of BrdU++ cells within each region. (E) BrdU++ cells (marked by asterisks) were counted from 200× images, and their location was determined from the images generated in D. Inset, 400× magnified images of four BrdU+ cells (pink nuclei) costained with anti-λ (blue surface stain). (F) The relative ratio of λ+/BrdU+ cells in the follicles and MZs of the spleen was calculated for 8 and 12 wk after immunization. Mean values were calculated from five to six different follicle and MZ regions at each time point. Error bars represent the propagated error of the mean of each ratio. Bars: (A–C) 1 mm; (D and E) 500 μm.

References

    1. Ahmed, R., and D. Gray. 1996. Immunological memory and protective immunity: understanding their relation. Science. 272:54–60. - PubMed
    1. Bernasconi, N.L., E. Traggiai, and A. Lanzavecchia. 2002. Maintenance of serological memory by polyclonal activation of human memory B cells. Science. 298:2199–2202. - PubMed
    1. Dutton, R.W., L.M. Bradley, and S.L. Swain. 1998. T cell memory. Annu. Rev. Immunol. 16:201–223. - PubMed
    1. Tangye, S.G., D.T. Avery, E.K. Deenick, and P.D. Hodgkin. 2003. Intrinsic differences in the proliferation of naive and memory human B cells as a mechanism for enhanced secondary immune responses. J. Immunol. 170:686–694. - PubMed
    1. Agematsu, K., H. Nagumo, F.C. Yang, T. Nakazawa, K. Fukushima, S. Ito, K. Sugita, T. Mori, T. Kobata, C. Morimoto, and A. Komiyama. 1997. B cell subpopulations separated by CD27 and crucial collaboration of CD27+ B cells and helper T cells in immunoglobulin production. Eur. J. Immunol. 27:2073–2079. - PubMed

Publication types

MeSH terms