. 2007 Sep 3;204(9):2115-29.
doi: 10.1084/jem.20070550. Epub 2007 Aug 13.

Presenilins regulate alphabeta T cell development by modulating TCR signaling

Affiliations

Presenilins regulate alphabeta T cell development by modulating TCR signaling

Karen Laky et al. J Exp Med. .

Abstract

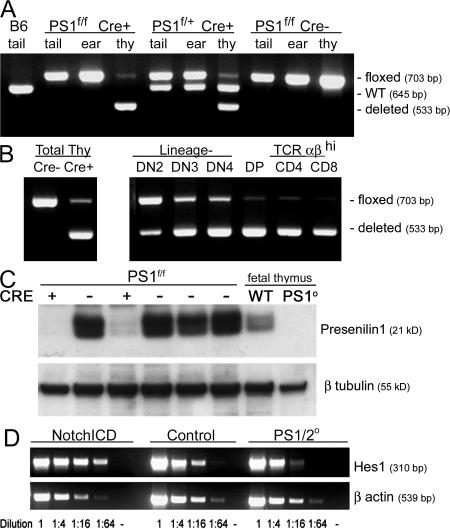
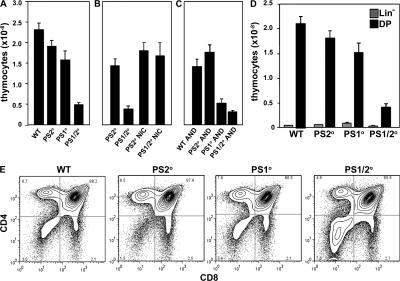
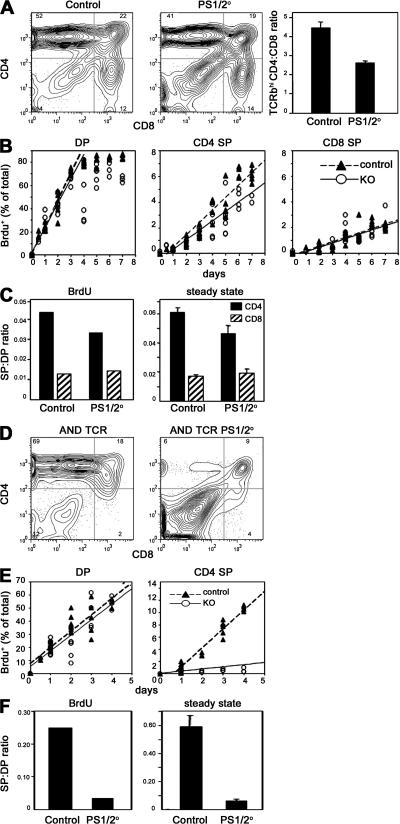
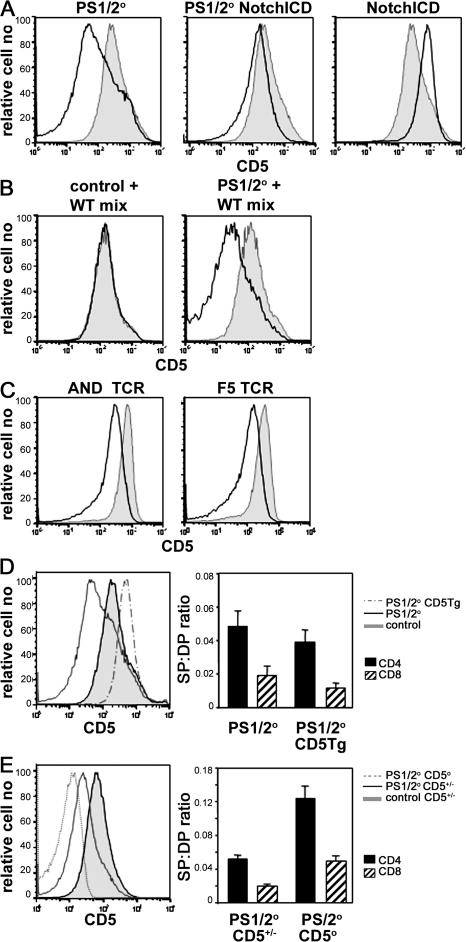
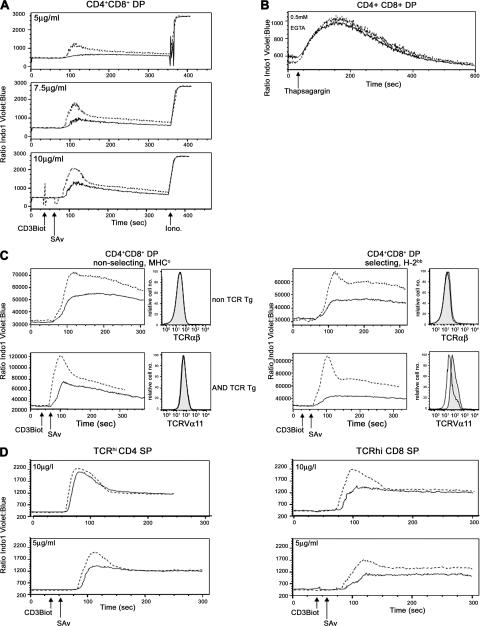
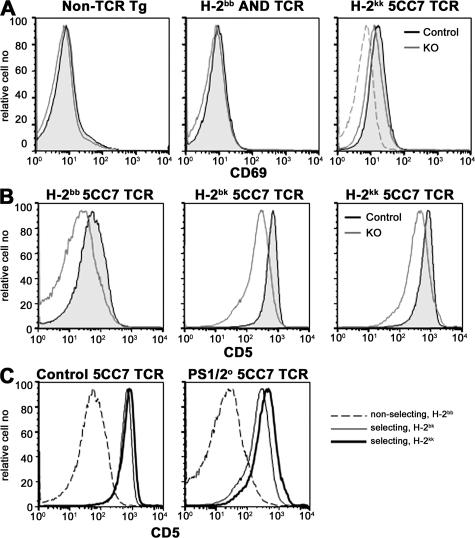
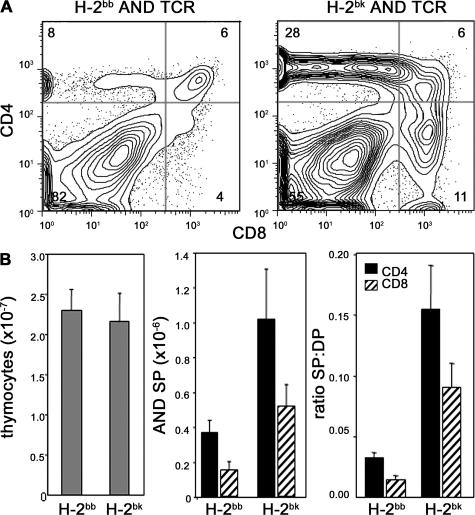
TCRalphabeta signaling is crucial for the maturation of CD4 and CD8 T cells, but the role of the Notch signaling pathway in this process is poorly understood. Genes encoding Presenilin (PS) 1/2 were deleted to prevent activation of the multiple Notch receptors expressed by developing thymocytes. PS1/2 knockout thymocyte precursors inefficiently generate CD4 T cells, a phenotype that is most pronounced when thymocytes bear a single major histocompatibility complex (MHC) class II-restricted T cell receptor (TCR). Diminished T cell production correlated with evidence of impaired TCR signaling, and could be rescued by manipulations that enhance MHC recognition. Although Notch appears to directly regulate binary fate decisions in many systems, these findings suggest a model in which PS-dependent Notch signaling influences positive selection and the development of alphabeta T cells by modifying TCR signal transduction.


Figures

Figure 1.
Figure 1.
Efficient deletion of the floxed PS1 allele by Cd4Cre in developing thymocytes. (A) PCR amplification of PS1 from the ear, tail, or thymus discriminates between the undeleted floxed allele (703 bp), the deleted allele (533 bp), and the endogenous (WT) PS1 gene (645 bp). A representative experiment assaying deletion in homozygous (lanes 2–4) or heterozygous (lane 5–7) PS1-floxed mice is shown. No deletion is seen in the absence of Cre (lanes 8–10). (B) Conditional PS1 gene deletion in total thymocytes (left) was staged by PCR analysis of sorted thymocytes from PS1 f/f Cre+ mice (right). (C) Western blot analysis for PS1 protein in lysates of thymocytes from six individual littermates bearing floxed PS1 with or without Cre expression. Lysates from fetal thymus of PS1+ and PS1−/− littermates are included as antisera specificity controls. (D) Semiquantitative RT-PCR analysis for Hes1 expression performed using total RNA isolated from thymocytes of transgenic pLck- NICD, control, or PS1/2KO mice. Template cDNA was serially diluted as indicated. A reaction with no cDNA template added (-) serves as a negative control.
Figure 2.
Figure 2.
Thymus cellularity is decreased in the absence of PSs. (A) Mean thymus cellularity of WT, PS2 KO, PS1 KO, and PS1/2KO mice. (B) Mean thymus cellularity of control and PS1/2KO with or without expression of transgenic NotchIC (NICD). (C) Mean thymus cellularity of H-2b WT, PS2 KO, PS1 KO, and PS1/2KO mice bearing transgenic AND TCR on a H-2b RAG2° background. (D) Mean number of lineage negative (gray bars) and CD4+CD8+ DP (black bars) thymocytes isolated from WT, PS2 KO, PS1 KO, and PS1/2KO mice. (E) Total thymocytes isolated from WT, PS2 KO, PS1 KO, and PS1/2KO littermates analyzed by flow cytometry for expression of CD4 and CD8. Error bars represent the SEM. n = 9–48 mice.
Figure 3.
Figure 3.
CD4 SP thymocytes are inefficiently generated in the absence of PSs. (A) Representative FACS plots analyzing the expression of CD4 and CD8 among the TCRβhi thymocytes from control and PS1/2KO mice. The bar graph shows the mean ratio of TCRβhi CD4 to CD8 thymocytes, which was calculated from cell counts and flow cytometric analysis of individual mice. Error bars represent the SEM. n = 37–40 mice. (B) Control and PS1/2KO thymocytes were labeled continuously with BrdU, as described in the Materials and methods. The kinetics of BrdU incorporation within the DP (CD4+CD8+) or TCRhi CD4 and CD8 SP thymocytes is plotted as a percentage of total thymocytes. Closed triangles and dotted lines represent control thymocytes. Open circles and solid lines represent PS1/2KO thymocytes. The slopes of the lines did not differ significantly between DP or CD8 SP thymocytes from control or KO mice, but were significantly different for control and KO CD4 SP thymocytes (P = 0.01). (C) Efficiency of generating mature CD4 SP (filled bar) or CD8 SP (hatched bar) thymocytes in control or PS1/2KO mice provided with continuous BrdU was calculated by dividing the rate of mature SP generated per day by the rate of immature DP thymocytes generated per day (left). Efficiency of generating mature CD4 SP (filled bar) or CD8 SP (hatched bar) in the steady state was estimated by determining the ratio of mature SP to immature DP thymocytes isolated from individual mice (right). Error bars represent the SEM. n = 37–40 mice. (D) Thymocytes from H-2b control and PS1/2KO mice bearing AND TCR analyzed for coexpression of CD4 and CD8 and gated for TCRVα11hi. (E) H-2b control (closed triangles and dashed lines) and PS1/2KO thymocytes (open circles and solid lines) bearing AND TCR labeled with continuous BrdU as described in B. Data points for BrdU+ CD4+CD8+ DP or TCRhi CD4 SP cells are shown as a percentage of total thymocytes plotted against labeling time. The slopes of the lines did not differ significantly between control and KO DP thymocytes, but were significantly different for control and KO CD4 SP thymocytes (P < 0.0001). (F) Efficiency of generating mature CD4 SP cells in H-2b control and PS1/2KO mice bearing AND TCR provided with continuous BrdU was estimated from the ratio of CD4 SP to DP thymocytes, as described in C (left). Efficiency of generating mature CD4 SP in steady state was estimated from the ratio of CD4 SP to DP thymocytes as described in C (P < 0.0001; right). Error bars represent the SEM. n = 36–46 mice.
Figure 4.
Figure 4.
Abnormally low CD5 expression by DP thymocytes in the absence of PSs. (A) Analysis for expression of CD5 on CD4+CD8+ DP thymocytes isolated from PS1/2KO (left, open histogram), PS1/2KO NotchICD (middle, open histogram), and NotchICD (right, open histogram) littermates. Analysis of a control littermate (shaded histogram) is overlaid for comparison. (B) Analysis for expression of CD5 on CD4+CD8+ DP thymocytes in mixed radiation chimeras that were prepared as described in Materials and methods. Histograms representing CD5 levels of wild-type B6 CD45.1+-derived DP thymocytes (shaded histogram) overlaid with CD45.2+-derived (open histogram) control (left) or PS1/2KO (right) DP thymocytes that developed in the same host. (C) Analysis for CD5 expression on DP thymocytes isolated from H-2b control (shaded histogram) and PS1/2KO (open histogram) littermates bearing AND (left) or F5 (right) TCR. (D) Analysis for expression of CD5 on DP thymocytes isolated from PS1/2KO littermates, with (dashed line) or without (solid line) a CD5 Tg. CD5 expressed on DP thymocytes isolated from a control littermate (shaded histogram) is overlaid for reference. An estimate of the mean efficiency of generating mature CD4 SP (filled bar) and CD8 SP (hatched bar) thymocytes in the steady state was estimated as in Fig. 3 C. Error bars represent the SEM. n =13–16 mice. (E) DP thymocytes isolated from CD5+/− (solid line) or CD5−/− (dotted line) PS1/2KO littermates and analyzed for expression of CD5. CD5 expression on CD4+CD8+ DP thymocytes isolated from a control CD5+/− littermate (shaded histogram) is overlaid for reference. An estimate of the mean efficiency of generating mature CD4 SP (filled bar) and CD8 SP (hatched bar) thymocytes in the steady state was estimated as in Fig. 3 C. Error bars represent the SEM. n = 15–20 mice.
Figure 5.
Figure 5.
Calcium flux in response to TCR cross-linking is reduced in PS-deficient DP thymocytes. (A) Mean of calcium flux measurements in CD4+CD8+ DP thymocytes isolated from control (dashed line) and PS1/2KO (solid line) after stimulation with concentrations of anti-CD3 indicated in the insets. (B) Calcium fluxes of DP thymocytes isolated from control (dashed line) and PS1/2KO (solid line) littermates in Ca-free media after the addition of thapsigargin. (C) Analysis for Ca2+ fluxes in thymocytes generated from BM chimeras made in MHC-deficient (left) or MHC-expressing (right) hosts. Calcium fluxes in PS2KO (dashed lines) or PS1/2KO (solid lines) DP thymocytes are compared in either mice with a diverse TCR repertoire (top) or an AND TCR (bottom). Histograms beside each calcium trace plot the levels of TCR expression by DP thymocytes derived from control PS2KO (shaded histogram) or PS1/2KO (open histogram) BM. (D) Analysis for Ca2+ flux as in A by TCRhi CD4+ or CD8+ SP thymocytes isolated from control (dotted line) and PS1/2KO (solid line) littermates.
Figure 6.
Figure 6.
PS-deficient DP thymocytes respond to selecting MHC by up-regulating CD5 and CD69. (A) Analysis for CD69 expression on CD4+CD8+ DP thymocytes isolated from control (shaded histogram) and PS1/2KO (open histogram) mice with either a diverse TCR repertoire (left), an AND TCR (middle), or a 5CC7 TCR (right) in a selecting MHC background. CD69 expressed on DP thymocytes isolated from control mice bearing 5CC7 TCR on the nonselecting H-2b background (dashed line) are overlaid for reference (right). (B) Analysis for expression of CD5 on positive DP thymocytes isolated from control (shaded histogram) and PS1/2KO (open) mice bearing 5CC7 TCR on the nonselecting H-2b, or selecting H-2bk or H-2kk background. (C) Same data as in B, replotted with control (left) or PS1/2KO (right) thymocytes of nonselecting H-2b (dashed lines) or selecting H-2bk (thin line) or H-2kk (thick line) background, overlaid for comparison.
Figure 7.
Figure 7.
Inefficient generation of CD4 SP thymocytes in PS-deficient mice is improved by increasing affinity of selecting MHC ligand. (A) Thymocytes of PS1/2KO mice bearing AND TCR on a H-2bb or H-2bk background, gated for TCRVα11hi and analyzed for expression of CD4 and CD8. (B) PS1/2KO mice bearing AND TCR on a H-2bb or H-2bk background analyzed for mean thymus cellularity (left), mean number of TCRVα11hi CD4 and CD8 SP thymocytes (middle), and the mean efficiency of generating mature CD4 SP and CD8 SP thymocytes in the steady state (right), calculated as in Fig. 3 C. Error bars represent the SEM. n =16–26 mice.

Similar articles

Cited by

References

    1. Robey, E., and B.J. Fowlkes. 1994. Selective events in T cell development. Annu. Rev. Immunol. 12:675–705. - PubMed
    1. Germain, R.N. 2002. T-cell development and the CD4-CD8 lineage decision. Nat. Rev. Immunol. 2:309–322. - PubMed
    1. Bosselut, R. 2004. CD4/CD8-lineage differentiation in the thymus: from nuclear effectors to membrane signals. Nat. Rev. Immunol. 4:529–540. - PubMed
    1. Ciofani, M., T.M. Schmitt, A. Ciofani, A.M. Michie, N. Cuburu, A. Aublin, J.L. Maryanski, and J.C. Zuniga-Pflucker. 2004. Obligatory role for cooperative signaling by pre-TCR and notch during thymocyte differentiation. J. Immunol. 172:5230–5239. - PubMed
    1. Wolfer, A., A. Wilson, M. Nemir, H.R. MacDonald, and F. Radtke. 2002. Inactivation of Notch1 impairs VDJβ rearrangement and allows pre-TCR-independent survival of early αβ lineage thymocytes. Immunity. 16:869–879. - PubMed

Publication types

MeSH terms