

beta-Scorpion toxin modifies gating transitions in all four voltage sensors of the sodium channel
- PMID: 17698594
- PMCID: PMC2151646
- DOI: 10.1085/jgp.200609719
beta-Scorpion toxin modifies gating transitions in all four voltage sensors of the sodium channel
Abstract
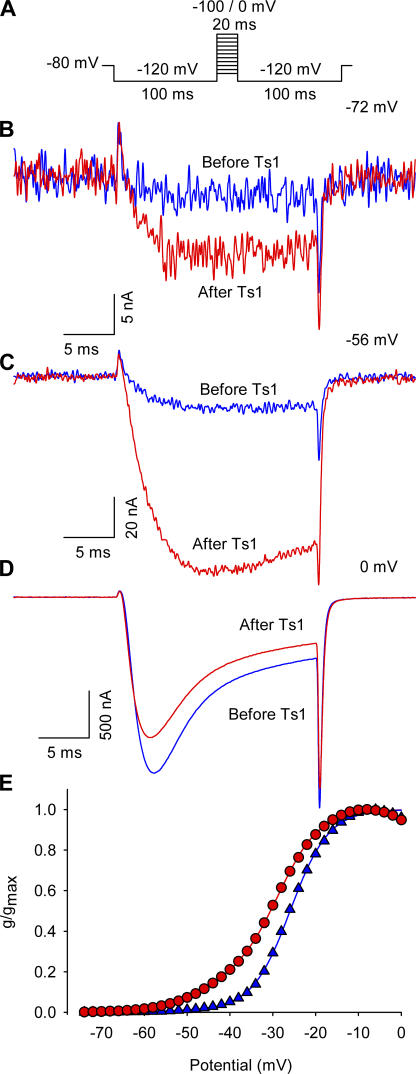
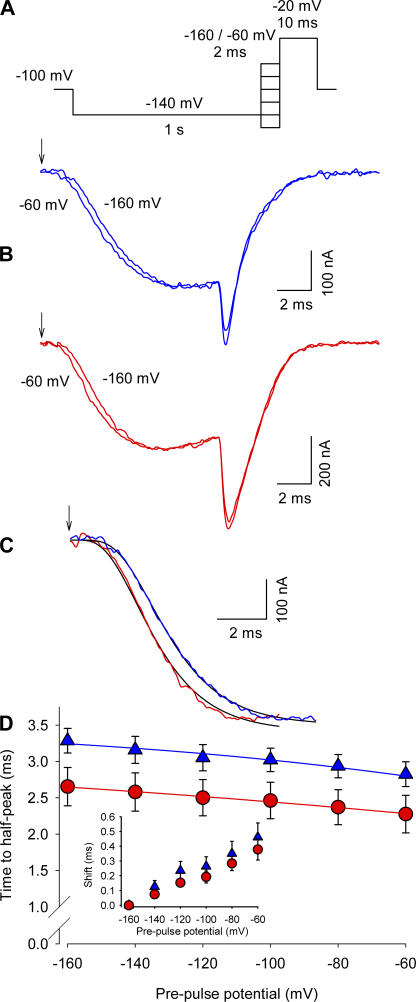
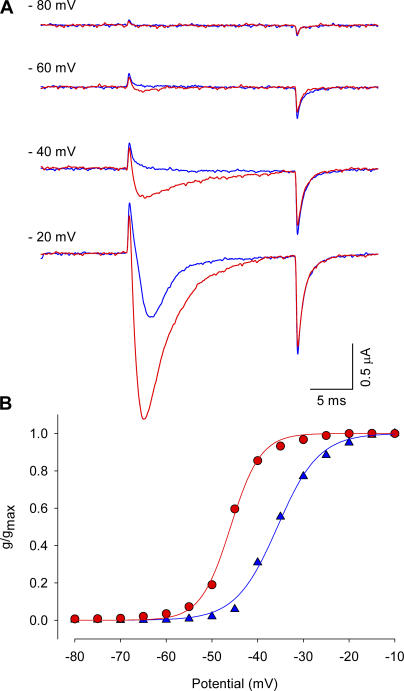
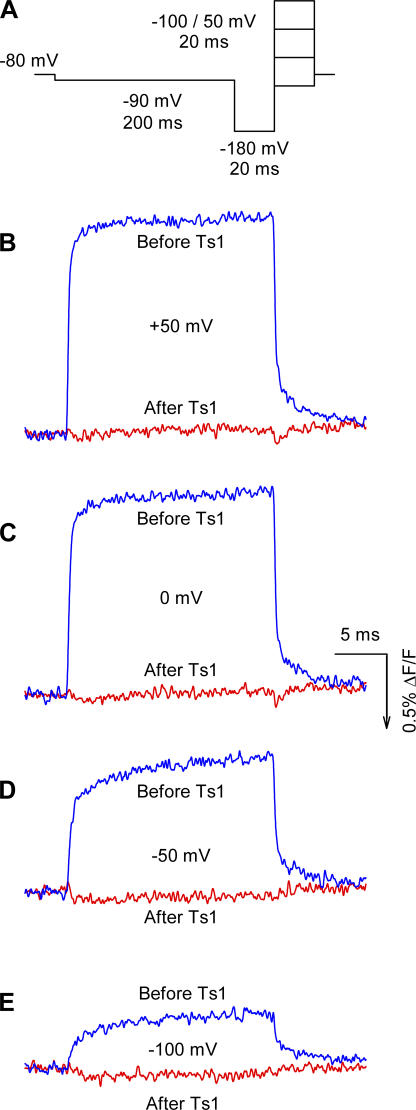
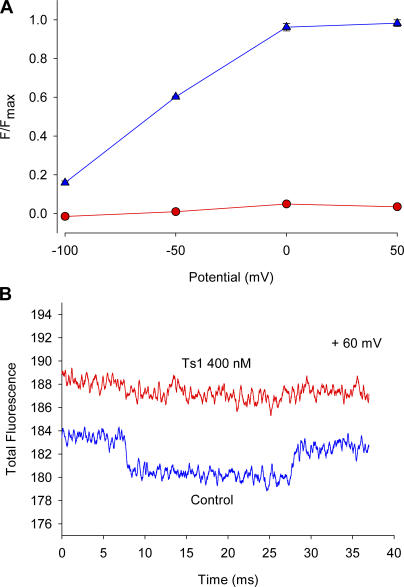
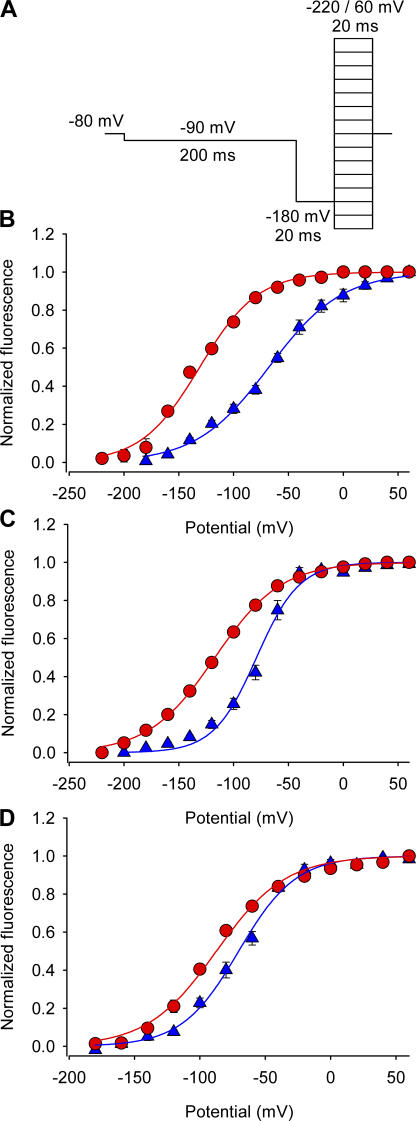
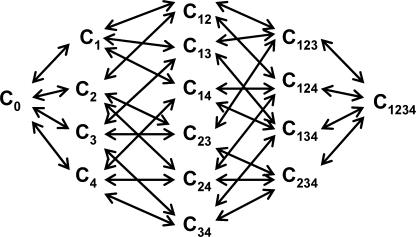
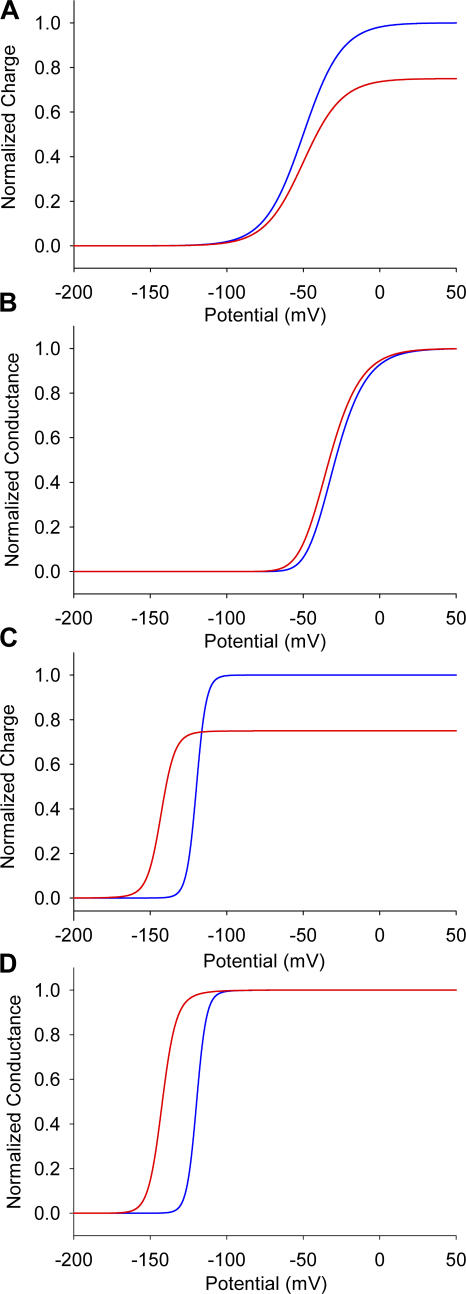
Several naturally occurring polypeptide neurotoxins target specific sites on the voltage-gated sodium channels. Of these, the gating modifier toxins alter the behavior of the sodium channels by stabilizing transient intermediate states in the channel gating pathway. Here we have used an integrated approach that combines electrophysiological and spectroscopic measurements to determine the structural rearrangements modified by the beta-scorpion toxin Ts1. Our data indicate that toxin binding to the channel is restricted to a single binding site on domain II voltage sensor. Analysis of Cole-Moore shifts suggests that the number of closed states in the activation sequence prior to channel opening is reduced in the presence of toxin. Measurements of charge-voltage relationships show that a fraction of the gating charge is immobilized in Ts1-modified channels. Interestingly, the charge-voltage relationship also shows an additional component at hyperpolarized potentials. Site-specific fluorescence measurements indicate that in presence of the toxin the voltage sensor of domain II remains trapped in the activated state. Furthermore, the binding of the toxin potentiates the activation of the other three voltage sensors of the sodium channel to more hyperpolarized potentials. These findings reveal how the binding of beta-scorpion toxin modifies channel function and provides insight into early gating transitions of sodium channels.
Figures

Similar articles
-
Substitutions in the domain III voltage-sensing module enhance the sensitivity of an insect sodium channel to a scorpion beta-toxin.J Biol Chem. 2011 May 6;286(18):15781-8. doi: 10.1074/jbc.M110.217000. Epub 2011 Mar 15. J Biol Chem. 2011. PMID: 21454658 Free PMC article.
-
Mapping of voltage sensor positions in resting and inactivated mammalian sodium channels by LRET.Proc Natl Acad Sci U S A. 2017 Mar 7;114(10):E1857-E1865. doi: 10.1073/pnas.1700453114. Epub 2017 Feb 15. Proc Natl Acad Sci U S A. 2017. PMID: 28202723 Free PMC article.
-
Inhibition of sodium channel gating by trapping the domain II voltage sensor with protoxin II.Mol Pharmacol. 2008 Mar;73(3):1020-8. doi: 10.1124/mol.107.041046. Epub 2007 Dec 21. Mol Pharmacol. 2008. PMID: 18156314
-
Insect-selective spider toxins targeting voltage-gated sodium channels.Toxicon. 2007 Mar 15;49(4):490-512. doi: 10.1016/j.toxicon.2006.11.027. Epub 2006 Dec 5. Toxicon. 2007. PMID: 17223149 Review.
-
Voltage-gated ion channels and gating modifier toxins.Toxicon. 2007 Feb;49(2):124-41. doi: 10.1016/j.toxicon.2006.09.022. Epub 2006 Sep 28. Toxicon. 2007. PMID: 17239913 Review.
Cited by
-
Na+ channel function, regulation, structure, trafficking and sequestration.J Physiol. 2015 Mar 15;593(6):1347-60. doi: 10.1113/jphysiol.2014.281428. J Physiol. 2015. PMID: 25772290 Free PMC article. Review.
-
Scorpion β-toxin interference with NaV channel voltage sensor gives rise to excitatory and depressant modes.J Gen Physiol. 2012 Apr;139(4):305-19. doi: 10.1085/jgp.201110720. J Gen Physiol. 2012. PMID: 22450487 Free PMC article.
-
The 70-year search for the voltage-sensing mechanism of ion channels.J Physiol. 2022 Jul;600(14):3227-3247. doi: 10.1113/JP282780. Epub 2022 Jul 6. J Physiol. 2022. PMID: 35665931 Free PMC article.
-
Substitutions in the domain III voltage-sensing module enhance the sensitivity of an insect sodium channel to a scorpion beta-toxin.J Biol Chem. 2011 May 6;286(18):15781-8. doi: 10.1074/jbc.M110.217000. Epub 2011 Mar 15. J Biol Chem. 2011. PMID: 21454658 Free PMC article.
-
Fifty years of gating currents and channel gating.J Gen Physiol. 2023 Aug 7;155(8):e202313380. doi: 10.1085/jgp.202313380. Epub 2023 Jul 6. J Gen Physiol. 2023. PMID: 37410612 Free PMC article. Review.
References
-
- Barhanin, J., J.R. Giglio, P. Leopold, A. Schmid, S.V. Sampaio, and M. Lazdunski. 1982. Tityus serrulatus venom contains two classes of toxins. Tityus gamma toxin is a new tool with a very high affinity for studying the Na+ channel. J. Biol. Chem. 257:12553–12558. - PubMed
-
- Catterall, W.A., S. Cestele, V. Yarov-Yarovoy, F.H. Yu, K. Konoki, and T. Scheuer. 2007. Voltage gated ion channels and gating modifier toxins. Toxicon. 49:124–141. - PubMed
-
- Cestèle, S., Q. Yusheng, J.C. Rogers, H. Rochat, T. Scheuer, and W.A. Catterall. 1998. Voltage sensor-trapping: enhanced activation of sodium channels by β-scorpion toxin bound to the S3–S4 loop in domain II. Neuron. 21:919–931. - PubMed
