. 2007 Sep;130(3):269-81.
doi: 10.1085/jgp.200709805. Epub 2007 Aug 13.

KCNE1 and KCNE3 stabilize and/or slow voltage sensing S4 segment of KCNQ1 channel

Affiliations

KCNE1 and KCNE3 stabilize and/or slow voltage sensing S4 segment of KCNQ1 channel

Koichi Nakajo et al. J Gen Physiol. 2007 Sep.

Abstract

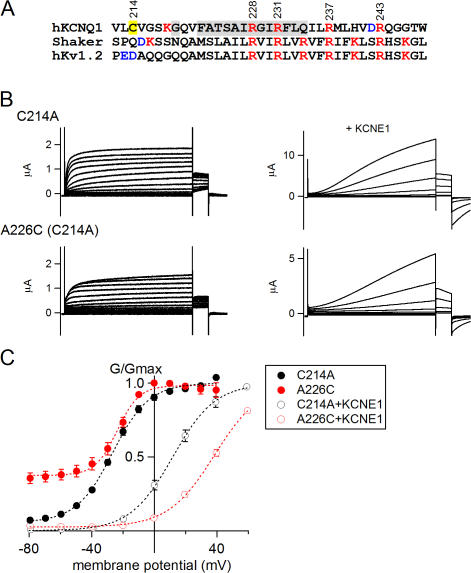
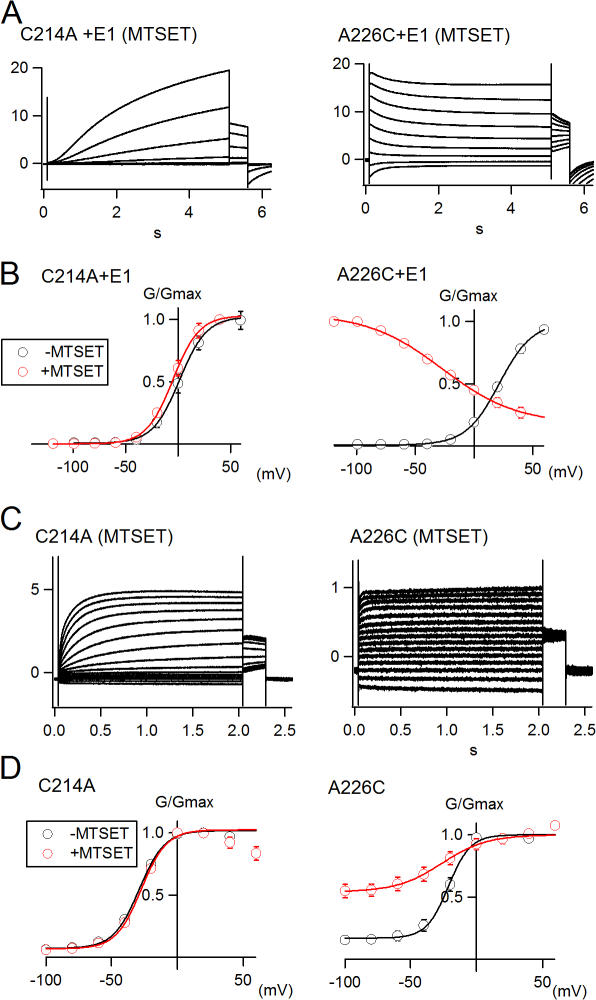
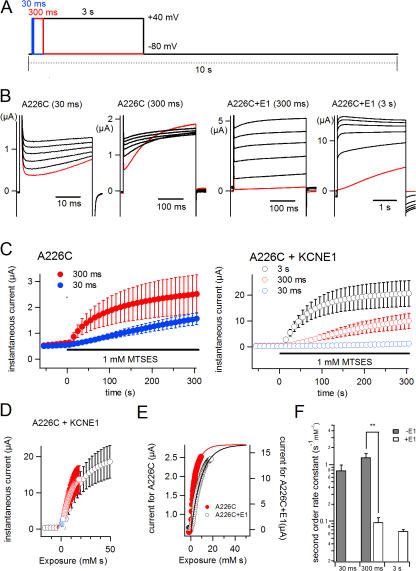
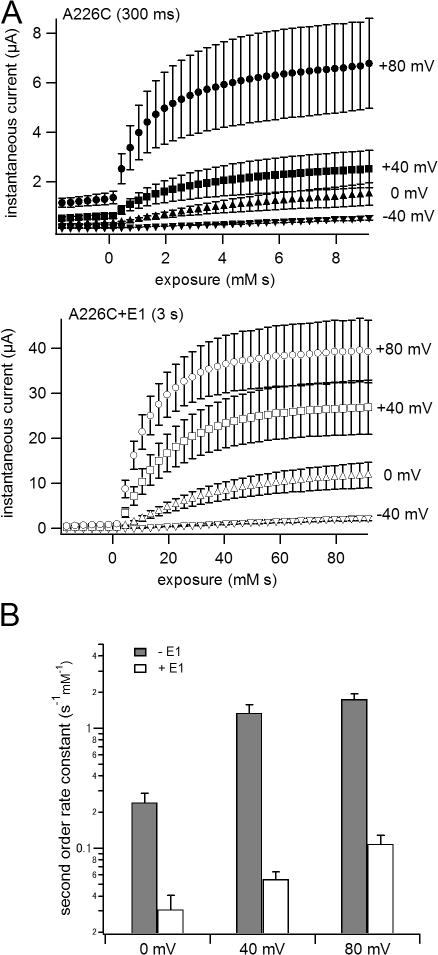
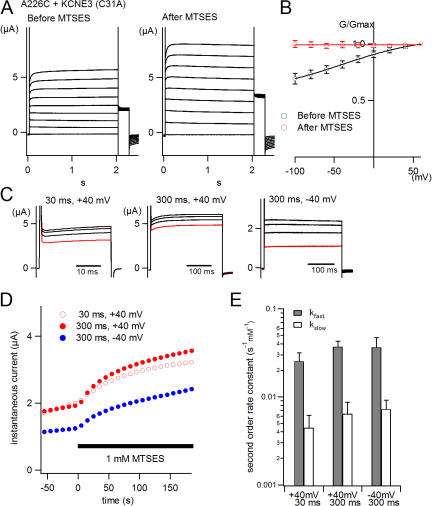
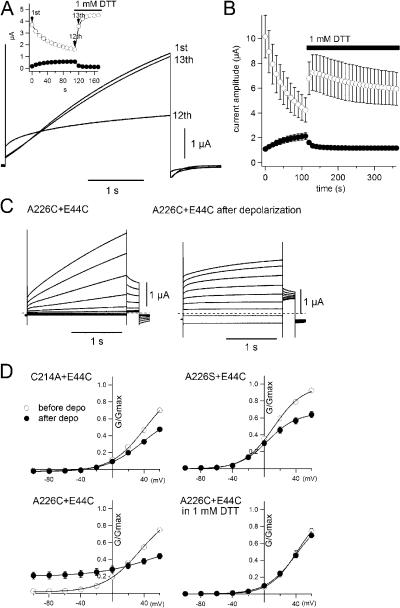
KCNQ1 is a voltage-dependent K(+) channel whose gating properties are dramatically altered by association with auxiliary KCNE proteins. For example, KCNE1, which is mainly expressed in heart and inner ear, markedly slows the activation kinetics of KCNQ1. Whether the voltage-sensing S4 segment moves differently in the presence of KCNE1 is not yet known, however. To address that question, we systematically introduced cysteine mutations, one at a time, into the first half of the S4 segment of human KCNQ1. A226C was found out as the most suited mutant for a methanethiosulfonate (MTS) accessibility analysis because it is located at the N-terminal end of S4 segment and its current was stable with repetitive stimuli in the absence of MTS reagent. MTS accessibility analysis revealed that the apparent second order rate constant for modification of the A226C mutant was state dependent, with faster modification during depolarization, and was 13 times slower in the presence of KCNE1 than in its absence. In the presence of KCNE3, on the other hand, the second order rate constant for modification was not state dependent, indicating that the C226 residue was always exposed to the extracellular milieu, even at the resting membrane potential. Taken together, these results suggest that KCNE1 stabilizes the S4 segment in the resting state and slows the rate of transition to the active state, while KCNE3 stabilizes the S4 segment in the active state. These results offer new insight into the mechanism of KCNQ1 channel modulation by KCNE1 and KCNE3.


Figures

Figure 1.
Figure 1.
Cysteine-scanning mutagenesis of the S4 segment of the KCNQ1 channel. (A) Amino acid sequences of the S3–S4 linker and S4 segment of human KCNQ1 (hKCNQ1), Drosophila Shaker (Shaker), and human Kv1.2 (hKv1.2) are aligned. Amino acids substituted with cysteine are shaded in gray. Endogenous cysteine (C214; yellow) was substituted with alanine in all mutants. Positively and negatively charged amino acids are indicated in red and blue, respectively. (B) Representative traces for C214A and A226C in the absence and presence of KCNE1. Membrane potential was depolarized for 2 s from −80 to +40 mV in 10-mV steps in the absence of KCNE1 and from −80 to +60 mV in 20-mV steps in the presence of KCNE1. (C) Conductance–voltage (G-V) relationships for C214A (black) and A226C (red) with (open symbols) and without (filled symbols) KCNE1 are shown. Data are fitted with Boltzmann equation (dotted curves, see Materials and Methods).
Figure 2.
Figure 2.
Reaction with MTS reagents locks A226C mutant open. (A) Representative traces for C214A and A226C obtained in the presence of KCNE1 (E1) after a 30-min pretreatment with 1 mM MTSET. A226C was stabilized in the open state after MTSET treatment. Membrane potential was stepped from −120 to +40 mV in 20-mV increments. Holding potential was −90 mV. (B) G-V curves with (red) and without (black) MTSET pretreatment in the presence of KCNE1. (C) Representative traces for C214A and A226C obtained in the absence of KCNE1 after a 30-min pretreatment with 1 mM MTSET. Membrane potential was stepped from −100 to +60 mV in 20-mV increments. Holding potential was −80 mV. (D) G-V curves with (red) and without (black) MTSET pretreatment in the absence of KCNE1.
Figure 3.
Figure 3.
MTS reaction rate is slowed in the KCNQ1–KCNE1 complex. (A) Pulse protocols for MTSES application. Depolarizing pulses (to +40 mV) with durations of 30 ms (blue), 300 ms (red), or 3 s (black) were applied every 10 s. (B) Representative traces for A226C (30 ms), A226C (300 ms), A226C+KCNE1 (300 ms), and A226C+E1 (3 s). Traces obtained just before applying MTSES are shown in red; those obtained 1, 2, 3, 4, and 5 min after the onset of MTSES application are shown in black. (C) Time courses of the MTSES reaction with A226C and A226C+KCNE1 with 30-ms (blue), 300-ms (red), and 3-s (black) depolarizing pulses. The timing of the MTSES application is indicated by black bars. (D) Time courses of MTSES reaction are replotted as functions of “exposure (mM sec)” (see Materials and Methods) of A226C+KCNE1 elicited by 30-ms (blue), 300-ms (red), and 3-s (black) depolarizing pulses. (E) Time courses of the MTSES reaction with 300-ms pulses in terms of “exposure” are compared between A226C and A226C+KCNE1 (E1). Filled red symbols represent A226C, open black symbols A226C+KCNE1. (F) Apparent second order rate constants are plotted. Although time courses of MTSES reaction with A226C (300 ms) and A226C+KCNE1 (3 s) were fitted by a double exponential function, only the faster time constants were used for calculation of the apparent second order rate constants. Filled bars represent rate constants without KCNE1, open bars the rate constants with KCNE1; **, P < 0.01.
Figure 4.
Figure 4.
MTS reaction rate is voltage dependent. (A) Time courses of MTSES reaction with A226C (300 ms) and A226C+KCNE1 (3 s) with depolarization to −40, 0, +40, and +80 mV are shown. (B) Apparent second order rate constants are plotted against voltage. Although time courses of the reaction with depolarizations to +40 and +80 mV were fitted with double exponential function, only the faster time constants were used for the calculation of the apparent second order rate constants. Filled bars represent rate constants without KCNE1, open bars the rate constants with KCNE1.
Figure 5.
Figure 5.
The rate of MTS reaction with the KCNQ1–KCNE3 complex is voltage independent. (A) Representative traces obtained from oocyte coexpressing KCNQ1 (A226C) and KCNE3 (C31A) before and 5 min after application of 1 mM MTSES. Membrane potential was stepped from a holding potential of −100 to +60 mV in 20-mV increments. (B) G-V relationships for A226C+KCNE3 before (black) and after (red) MTSES application. (C) Representative traces obtained with 30-ms depolarizations to +40 mV or 300-ms depolarizations to +40 or −40 mV in oocytes expressing A226C+KCNE3. Traces just before applying MTSES are shown in red; those recorded 1, 2, and 3 min after the onset of MTSES application are shown in black. (D) Time courses of the MTSES reaction with A226C+KCNE3. Error bars were omitted for clarity. The timing of MTSES application is indicated by a black bar. (E) Two second order rate constants (kfast and kslow) are plotted for each protocol. They are calculated from two time constants obtained from D fitted using a double exponential function.
Figure 6.
Figure 6.
A disulfide bond can form between KCNE1 and S4 of KCNQ1. (A) Current traces recorded from an oocyte coexpressing KCNQ1 (A226C) and KCNE1 (E44C) are shown. The oocyte was repetitively depolarized to +40 mV for 3 s every 10 s. Only the 1st, 12th, and 13th traces are shown. The current gradually ran down until by the 12th depolarization it was nearly flat. With subsequent addition of 1 mM DTT, the current immediately recovered the slow activation (13th depolarization). Thereafter, slow activation was retained in DTT. (inset) Time course of the run down and recovery by DTT. Filled and open symbols represent the instantaneous currents and the currents at the end of the depolarization, respectively. Black bar represents the presence of 1 mM DTT in the bath solution. (B) Time course of current amplitude upon DTT application (n = 5). Filled and open symbols represent the instantaneous currents and the currents at the end of the depolarization, respectively. Black bar represents the presence of 1 mM DTT in bath solution. (C) Representative traces obtained from oocyte coexpressing KCNQ1 A226C mutant and KCNE1 E44C mutant. Membrane potential was stepped from a holding potential of −100 to +60 mV in 20-mV increments. After the first set of voltage pulses (left), oocyte is depolarized at +40 mV for 1 min to facilitate the disulfide formation. Second set of voltage pulses was applied after 1 min depolarization (right). (D) G-V curves for the KCNQ mutants with KCNE1 (E44C) mutant. Open and filled symbols represent G-V curves before and after 1 min depolarization at +40 mV, respectively.

Similar articles

Cited by

References

    1. Abbott, G.W., F. Sesti, I. Splawski, M.E. Buck, M.H. Lehmann, K.W. Timothy, M.T. Keating, and S.A. Goldstein. 1999. MiRP1 forms IKr potassium channels with HERG and is associated with cardiac arrhythmia. Cell. 97:175–187. - PubMed
    1. Abbott, G.W., M.H. Butler, S. Bendahhou, M.C. Dalakas, L.J. Ptacek, and S.A. Goldstein. 2001. MiRP2 forms potassium channels in skeletal muscle with Kv3.4 and is associated with periodic paralysis. Cell. 104:217–231. - PubMed
    1. Akabas, M.H., D.A. Stauffer, M. Xu, and A. Karlin. 1992. Acetylcholine receptor channel structure probed in cysteine-substitution mutants. Science. 258:307–310. - PubMed
    1. Barhanin, J., F. Lesage, E. Guillemare, M. Fink, M. Lazdunski, and G. Romey. 1996. KVLQT1 and lsK (minK) proteins associate to form the IKs cardiac potassium current. Nature. 384:78–80. - PubMed
    1. Bell, D.C., H. Yao, R.C. Saenger, J.H. Riley, and S.A. Siegelbaum. 2004. Changes in local S4 environment provide a voltage-sensing mechanism for mammalian hyperpolarization-activated HCN channels. J. Gen. Physiol. 123:5–19. - PMC - PubMed

Publication types

MeSH terms