. 2007 Aug 13;178(4):675-86.
doi: 10.1083/jcb.200701133.

Src kinase activity and SH2 domain regulate the dynamics of Src association with lipid and protein targets

Affiliations

Src kinase activity and SH2 domain regulate the dynamics of Src association with lipid and protein targets

Dmitry E Shvartsman et al. J Cell Biol. .

Abstract

Src functions depend on its association with the plasma membrane and with specific membrane-associated assemblies. Many aspects of these interactions are unclear. We investigated the functions of kinase, SH2, and SH3 domains in Src membrane interactions. We used FRAP beam-size analysis in live cells expressing a series of c-Src-GFP proteins with targeted mutations in specific domains together with biochemical experiments to determine whether the mutants can generate and bind to phosphotyrosyl proteins. Wild-type Src displays lipid-like membrane association, whereas constitutively active Src-Y527F interacts transiently with slower-diffusing membrane-associated proteins. These interactions require Src kinase activity and SH2 binding, but not SH3 binding. Furthermore, overexpression of paxillin, an Src substrate with a high cytoplasmic population, competes with membrane phosphotyrosyl protein targets for binding to activated Src. Our observations indicate that the interactions of Src with lipid and protein targets are dynamic and that the kinase and SH2 domain cooperate in the membrane targeting of Src.


Figures

Figure 1.
Figure 1.
Membrane association and cellular distribution of Src-WT-GFP and Src-Y527F-GFP. COS-7 cells were transfected with one of the above constructs as described under Materials and methods. (A) Percentage of Src-GFP in supernatant (S; cytosol) and pellet (P; membrane). After subcellular fractionation, equal proportions (5% vol/vol) of each fraction were quantified by immunoblotting. The immunoblot (IB) panels (blotting for GFP to identify Src-GFP proteins or for lactate dehydrogenase [LDH] and caveolin1 [Cav1] as cytosolic and membrane markers, respectively) are from a representative experiment, whereas the bar graph shows means ± SEM (n = 3) of multiple experiments. The percentage of Src-Y527F-GFP in pellet was somewhat higher, but the difference was not significant (P > 0.05; t test). (B) Cellular distribution of Src-WT-GFP and Src-Y527F-GFP. Transfected cells were fixed, permeabilized, and immunostained for vinculin (1:100 dilution of mouse anti-vinculin ascites, followed by 30 μg/ml Cy3 goat anti–mouse IgG). Fluorescence confocal imaging was as described in Materials and methods. Arrowheads point at vinculin (red) in focal adhesions; arrows indicate colocalization of Src (observed for Src-Y527F-GFP but not for Src-WT-GFP) with vinculin. Bar, 10 μm.
Figure 2.
Figure 2.
Typical curves showing that the FRAP rate of Src-Y527F-GFP is slow relative to that of Src-WT-GFP. FRAP experiments were conducted at 22°C on COS-7 cells transiently expressing EGFP (GFP; A), Src-WT-GFP (B), or Src-Y527F-GFP (C), using the 63× objective (see Materials and methods). Solid lines show the best fit of a nonlinear regression analysis, with the resulting τ and mobile fraction (Rf) values. (A) Free GFP recovers instantaneously on the experimental time scale, demonstrating that free diffusion in the cytoplasm does not contribute to the measurements in the other panels. (B and C) Src-WT-GFP displays slower FRAP enabling measurement of τ, whereas Src-Y527F-GFP exhibits a further notable reduction in the recovery kinetics.
Figure 3.
Figure 3.
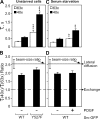
FRAP beam-size analysis of the membrane interactions of Src-WT-GFP and Src-Y527F-GFP. FRAP experiments were conducted as in Fig. 2 on cells grown with 10% FCS (A and B) or on serum-starved cells with or without PDGF stimulation (C and D). Bars are means ± SEM of 40–60 measurements. Two beam sizes were generated using 63× and 40× objectives, and the τ values were determined with each. The ratio between the areas illuminated by the two beams was 2.56 ± 0.30 (n = 39); this ratio (B and D, solid lines) is expected for FRAP by lateral diffusion, whereas a ratio of 1 (broken lines) is expected for recovery by exchange (Henis et al., 2006). The Rf values were high in all cases (averaging 0.98 for Src-WT-GFP and 0.92 for Src-Y527F-GFP). (A) τ values in unstarved cells. The differences between the τ(63×) or τ(40×) values of Src-Y527F and Src-WT were highly significant, comparing the two proteins with the same beam size (***, P < 10−17; t test). (B) τ(40×)/τ(63×) ratios in unstarved cells. The τ ratio of Src-WT-GFP (but not of Src-Y527F-GFP) differed significantly from the 2.56 ratio between the measured beam sizes (P < 0.005). (C) Effects of serum starvation and PDGF on the τ values of Src-WT-GFP. PDGF stimulation (see Materials and methods) significantly increased the τ values of Src-WT (**, P < 10−9). (D) τ(40×)/τ(63×) ratios derived from C. Both τ ratios are significantly below the 2.56 beam-size ratio (P < 0.05).
Figure 4.
Figure 4.
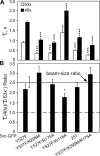
FRAP studies demonstrate distinct roles for Src kinase activity and SH2 and SH3 domains in Src membrane interactions. FRAP experiments were conducted as in Fig. 3. Results are mean ± SEM of 40–60 measurements. The Rf values were high in all cases (≥0.92; not depicted). (A) τ values. Asterisks indicate significant differences from τ(63×) or τ(40×) measured for Src-Y527F-GFP (**, P < 0.001; ***, P < 10−7). (B) τ(40×)/τ(63×) ratios. Only the τ(40×)/τ(63×) ratio of Src-Y527F/W118A is significantly different from 2.56 ± 0.3 (*, P < 0.005). The D values calculated for the various mutants are given in the text.
Figure 5.
Figure 5.
Binding of pTyr proteins from cells expressing Src-GFP mutants to GST-Src domain fusion proteins. COS-7 cells were transfected with vectors encoding different Src-GFP proteins or GFP (control) and lysed (see Materials and methods). After protein and Src-GFP level determination, 6 aliquots (0.5 mg protein) from each lysate were precipitated by GST-Src domain fusion proteins coupled to glutathione–Sepharose beads, followed by 8.5% SDS-PAGE and immunoblotting. The GST-Src domain constructs (see Table S2, available at http://www.jcb.org/cgi/content/full/jcb.200701133/DC1) were as follows: GST-SH3, GST-SH2, GST-SH3/SH2 (including both domains), GST-SH3/SH2* (SH2 with R175A mutation), and GST-SH3*/SH2 (SH3 with W118A mutation). A and B depict a representative experiment, whereas C gives the means ± SEM (n = 3) of multiple experiments. (A) Typical blots of pTyr proteins precipitated from cells transfected with the indicated Src-GFP plasmids. Blots were probed with mouse anti-pTyr followed by IRDye 800 goat anti–mouse IgG. Although many pTyr proteins are precipitated by both GST-SH2 and GST-SH3, presumably because they contain binding sites for both, some are precipitated selectively by one but not the other (right, asterisks). (B) Expression levels of the Src-GFP proteins in the cells shown in A. From each lysate, 25 μg protein was resolved by 8.5% SDS-PAGE and immunoblotted with rabbit anti-GFP and Alexa 680 goat anti–rabbit IgG. (C) Quantification of precipitated pTyr proteins. Results are mean ± SEM of three experiments. For each lane shown in A, the sum of the intensities of all bands (the cumulative pTyr precipitated by a specific GST fusion protein) was calibrated according to the Src-GFP level in the same transfection (B). The results are presented relative to the calibrated level of pTyr proteins precipitated by GST-SH3/SH2 from cells transfected with Src-Y527F-GFP within each set of experiments, taking this value as 100.
Figure 6.
Figure 6.
FRAP studies on the effects of paxillin-DsRed2 on Src membrane interactions. COS-7 cells were transfected with Src-GFP and paxillin-DsRed2 or paxillin-Y31F/Y118F-DsRed2 (Pax-2F; 1:10 DNA ratio) as indicated in B. Coexpressing cells were selected by their fluorescence and subjected to FRAP studies on Src-GFP as in Fig. 4. Results are mean ± SEM of 40–60 measurements. The Rf values were high in all cases (≥0.92; not depicted). (A) τ values. Asterisks indicate significant differences between the τ(63×) or τ(40×) values, comparing cells expressing Src-GFP alone versus cells coexpressing Src-GFP and paxillin-DsRed2 (*, P < 0.05; **, P < 0.001; ***, P < 10−7). (B) τ(40×)/τ(63×) ratios. Statistical analysis comparing the effects of paxillin expression on the τ ratios of specific Src-GFP proteins (Src-GFP alone vs. Src-GFP coexpressed with paxillin-DsRed2 or Pax-2F) showed significant effects only for Src-Y527F and Src-Y527F/K295M coexpressed with paxillin-DsRed2 (*, P < 0.05; **, P < 0.001).
Figure 7.
Figure 7.
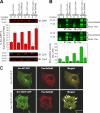
Paxillin and paxillin-DsRed2 display high cytoplasmic fractions and are tyrosine phosphorylated by coexpressed Src-Y527F-GFP. COS-7 cells were cotransfected with vectors encoding Src-WT-GFP or Src-Y527F-GFP and paxillin-DsRed2 (Pax-DsRed2) or empty vector (1:10 DNA ratio). (A) Distribution of Src-GFP between cytosolic (S) and pellet (P) fractions. Subcellular fractionation, immunoblotting, and quantification were conducted as in Fig. 1 A. The blots depict representative experiments; bars are mean ± SEM (n = 3) of multiple experiments. Overexpression of paxillin-DsRed2 slightly increased the percentage in pellet of Src-Y527F (*, P < 0.05). (B) Distribution and tyrosine phosphorylation of endogenous paxillin (Endo. Pax) and paxillin-DsRed2. Equal percentages (vol/vol) of each fraction were immunoprecipitated (IP) by anti-paxillin, followed by SDS-PAGE and immunoblotting (IB) with anti-pTyr (top) or anti-paxillin (middle; representative experiments). Bars depict means ± SEM (n = 3) of multiple experiments. To quantify pTyr in the paxillin and paxillin-DsRed2 bands, the sum of their intensities in each lane of the pTyr blots was calibrated according to the total paxillin level (paxillin-DsRed2 plus endogenous paxillin in both the cytosolic and pellet fractions) in the same transfection. The results are presented relative to the calibrated pTyr level precipitated from the cytosolic fraction of cells cotransfected with Src-Y527F and paxillin-DsRed2, taking this value as 100. Src-Y527F increased the levels of pTyr-paxillin and pTyr-paxillin-DsRed2 in both cytosolic and pellet to a significantly higher level than Src-WT (P < 0.001). (C) Cellular distribution of paxillin-DsRed2 coexpressed with Src-WT-GFP or Src-Y527F-GFP. Confocal images were obtained as in Fig. 1 B. Arrows indicate Src-GFP and paxillin-DsRed2 colocalized spots (observed for Src-Y527F-GFP but not for Src-WT-GFP). Bar, 20 μm.
Figure 8.
Figure 8.
Interaction of Src with its substrates. (A) Lateral diffusion and membrane-cytosol exchange of free or substrate-bound Src. Inactive Src (1) interacts with the membrane primarily through its myristoyl anchor (purple) and the adjacent polybasic sequence and exhibits both lipid-like lateral diffusion and exchange with the cytosol. Upon activation, the open-conformation, active Src binds transiently to TM substrates, retarding its lateral diffusion and exchange (2). The mobility-retarding interactions depend mainly on SH2 domain interactions with pTyr sites (high affinity; blue arrows), with only a minor contribution of SH3 domain binding (low affinity; green arrows). Activated Src binds also to peripheral protein substrates, which compete for Src binding with the TM proteins (3 and 4). Upon binding to a peripheral protein that undergoes exchange between membrane and cytosolic pools, Src retains the N-terminal lipid-like membrane interactions; the rates of exchange and lateral diffusion of Src in complex with the peripheral protein would be affected by the membrane interactions of the latter. (B) Dependence of Src substrate phosphorylation on the Src SH2 domain: the processive multisite model. In this model, Src binds initially to the substrate (1) and phosphorylates it (red arrow; 2). This enhances the binding of Src to the substrate via its SH2 domain (3) and promotes further phosphorylation of the substrate at additional sites (processive phosphorylation; red arrows; 4). Other models that account for the SH2 dependence of Src substrate phosphorylation include protection of the pTyr residues (red circles) from pTyr protein phosphatases and targeting of Src to substrates by binding to other pTyr proteins.

Similar articles

Cited by

References

    1. Abram, C.L., and S.A. Courtneidge. 2000. Src family tyrosine kinases and growth factor signaling. Exp. Cell Res. 254:1–13. - PubMed
    1. Bjorge, J.D., C. Bellagamba, H.C. Cheng, A. Tanaka, J.H. Wang, and D.J. Fujita. 1995. Characterization of two activated mutants of human pp60c-src that escape c-Src kinase regulation by distinct mechanisms. J. Biol. Chem. 270:24222–24228. - PubMed
    1. Bjorge, J.D., A. Jakymiw, and D.J. Fujita. 2000. Selected glimpses into the activation and function of Src kinase. Oncogene. 19:5620–5635. - PubMed
    1. Broome, M.A., and T. Hunter. 1996. Requirement for c-Src catalytic activity and the SH3 domain in platelet-derived growth factor BB and epidermal growth factor mitogenic signaling. J. Biol. Chem. 271:16798–16806. - PubMed
    1. Buss, J.E., M.P. Kamps, K. Gould, and B.M. Sefton. 1986. The absence of myristic acid decreases membrane binding of p60src but does not affect tyrosine protein kinase activity. J. Virol. 58:468–474. - PMC - PubMed

Publication types