. 2007 Oct;13(10):1793-802.
doi: 10.1261/rna.587607. Epub 2007 Aug 13.

Instrumentation and metrology for single RNA counting in biological complexes or nanoparticles by a single-molecule dual-view system

Affiliations

Instrumentation and metrology for single RNA counting in biological complexes or nanoparticles by a single-molecule dual-view system

Hui Zhang et al. RNA. 2007 Oct.

Abstract

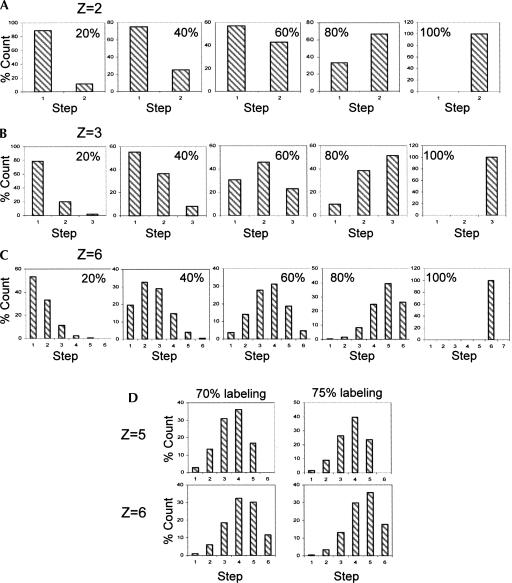
Limited by the spatial resolution of optical microscopy, direct detection or counting of single components in biological complexes or nanoparticles is challenging, especially for RNA, which is conformationally versatile and structurally flexible. We report here the assembly of a customized single-molecule dual-viewing total internal reflection fluorescence imaging system for direct counting of RNA building blocks. The RNA molecules were labeled with a single fluorophore by in vitro transcription in the presence of a fluorescent AMP. Precise calculation of identical or mixed pRNA building blocks of one, two, three, or six copies within the bacteriophage phi29 DNA packaging motor or other complexes was demonstrated by applying a photobleaching assay and evaluated by binomial distribution. The dual-viewing system for excitation and recording at different wavelengths simultaneously will enable the differentiation of different complexes with different labels or relative motion of each labeled component in motion machines.


Figures

FIGURE 1.
FIGURE 1.
Setup of single-molecule dual-viewing TIRF imaging system (SMDV-TIRF). After the fluorescence image was recorded on the CCD chip of the camera, the data were analyzed by the computer software and converted to an intensity versus time plot to show photobleaching steps. The typical photobleaching trace was obtained by subtracting the background time trajectory of a dark region (red circle) from that of a fluorescent spot (white circle).
FIGURE 2.
FIGURE 2.
Comparison of the time trajectory of relative average intensity for the same fluorescent spot when using circles of different sizes in software analysis. (A) The area of the circle a = 15.6 μm2; (B) a = 10 μm2; (C) a = 3.4 μm2.
FIGURE 3.
FIGURE 3.
Analysis of fluorescent particles composed of different protein/pRNA complexes. The insets depict the assembly of the different protein/pRNA complexes. The dark gray dot represents Cy3 label to pRNA at 5′ end. Z indicates the copy number of labeled pRNA within each complex. The fluorescence intensity is shown in arbitrary units (A.U.). The theoretical predictions were based on 63% Cy3 labeling efficiency. (A) His-gp16/ monomeric Cy3-pRNA complex (Z = 1). (B) His-gp16/ dimeric Cy3-pRNA complex (Z = 2). (C) Procapsid/pRNA complex made from single Cy3-labeled pRNA dimer; each resulting nanoparticle contains three labeled pRNAs (Z = 3). (D) Procapsid/pRNA complex made from homogeneous Cy3-pRNA; each resulting nanoparticle contains six labeled pRNAs (Z = 6).
FIGURE 4.
FIGURE 4.
Yang Hui triangle (Pascal's triangle) for binomial coefficient.
FIGURE 5.
FIGURE 5.
Theoretical histograms of photobleaching step distributions at different labeling efficiencies of 20%, 40%, 60%, 80%, and 100%. (A) Models for Z = 2. (B) Models for Z = 3. (C) Models for Z = 6. (D) Comparison of theoretical models for Z = 5 and Z = 6 at 70% and 75% labeling efficiencies, respectively.
FIGURE 6.
FIGURE 6.
Comparison of the experimental data of pRNA with (A) 63% labeling efficiency and (B) 70% labeling efficiency for particles containing six Cy3-pRNA molecules. The number above each column indicates the actual count.
FIGURE 7.
FIGURE 7.
Dual-color fluorescence images of (A) the procapsid/pRNA complexes containing dual-labeled pRNA, (B) the procapsid/pRNA complexes containing only Cy3-labeled pRNA, and (C) the procapsid/pRNA complexes containing only Cy5-labeled pRNA, as depicted. The fluorescence images are shown in pseudocolor. The images on the right are the overlap from the two channels.
FIGURE 8.
FIGURE 8.
Photobleaching curves of dual-labeled procapsid/pRNA complexes assembled from both Cy3- and Cy5-labeled individual pRNA building blocks (Guo et al. 1998). (A) One Cy3-pRNA and five Cy5-pRNAs; (B) two Cy3-pRNAs and four Cy5-pRNAs; (C) three Cy3-pRNAs and three Cy5-pRNAs. (Insets) Clearer views of the individual colored plots. (Gray arrows) Indicate where the fluorescence intensity drops (photobleaching steps).

Similar articles

Cited by

References

    1. Abels, J.A., Moreno-Herrero, F., van der Heijden, T., Dekker, C.F., Dekker, N.H. Single-molecule measurements of the persistence length of double-stranded RNA. Biophys. J. 2005;88:2737–2744. - PMC - PubMed
    1. Adachi, K., Yasuda, R., Noji, H., Itoh, H., Harada, Y., Yoshida, M., Kinosita K., Jr Stepping rotation of F1-ATPase visualized through angle-resolved single- fluorophore imaging. Proc. Natl. Acad. Sci. 2000;97:7243–7247. - PMC - PubMed
    1. Ambrose, W.P., Goodwin, P.M., Nolan, J.P. Single-molecule detection with total internal reflection excitation: Comparing signal-to-background and total signals in different geometries. Cytometry. 1999;36:224–231. - PubMed
    1. Balci, H., Ha, T., Sweeney, H.L., Selvin, P.R. Interhead distance measurements in myosin VI via SHRImP support a simplified hand-over-hand model. Biophys. J. 2005;89:413–417. - PMC - PubMed
    1. Block, S.M., Goldstein, L.S., Schnapp, B.J. Bead movement by single kinesin molecules studied with optical tweezers. Nature. 1990;348:348–352. - PubMed

Publication types

MeSH terms

LinkOut - more resources