

Copb1-facilitated axonal transport and translation of kappa opioid-receptor mRNA
- PMID: 17698811
- PMCID: PMC1959464
- DOI: 10.1073/pnas.0703805104
Copb1-facilitated axonal transport and translation of kappa opioid-receptor mRNA
Abstract
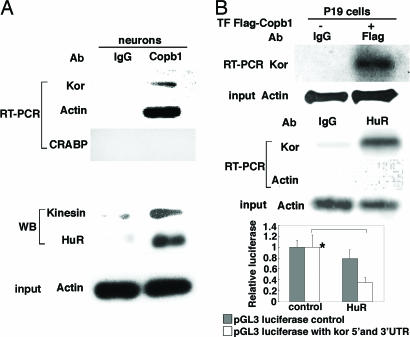
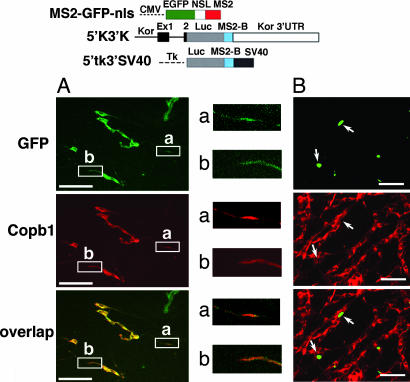
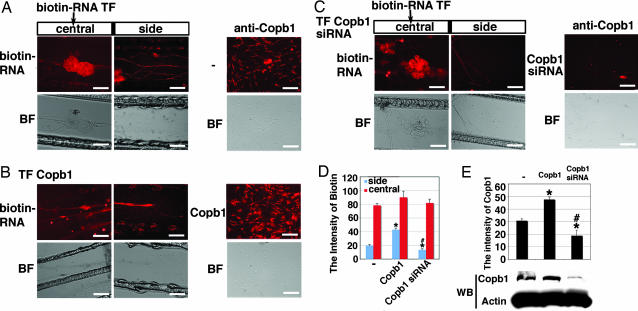
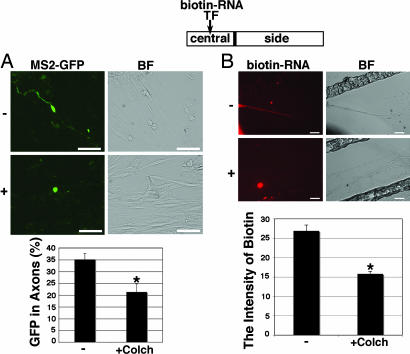
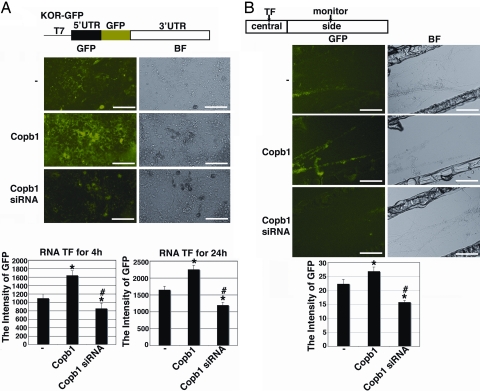
mRNA of kappa opioid receptor (KOR) can be transported to nerve fibers, including axons of dorsal root ganglia (DRG), and can be locally translated. Yeast three-hybrid screening identifies Copb1 as a kor mRNA-associated protein that form complexes with endogenous kor mRNA, which are colocalized in the soma and axons of DRG neurons. Axonal transport of kor mRNA is demonstrated, directly, by observing mobilization of biotin-labeled kor mRNA in Campenot chambers. Efficient transport of kor mRNA into the side chamber requires Copb1 and can be blocked by a drug that disrupts microtubules. The requirement for Copb1 in mobilizing kor mRNA is confirmed by using the MS2-GFP mRNA-tagging system. Furthermore, Copb1 also facilitates the translation of kor mRNA in the soma and axons. This study provides evidence for a microtubule-dependent, active axonal kor mRNA-transport process that involves Copb1 and can stimulate localized translation and suggests coupling of transport and translation of mRNAs destined to the remote areas such as axons.
Conflict of interest statement
The authors declare no conflict of interest.
Figures
Similar articles
-
Axonal mRNA transport and localized translational regulation of kappa-opioid receptor in primary neurons of dorsal root ganglia.Proc Natl Acad Sci U S A. 2006 Dec 26;103(52):19919-24. doi: 10.1073/pnas.0607394104. Epub 2006 Dec 13. Proc Natl Acad Sci U S A. 2006. PMID: 17167054 Free PMC article.
-
Mouse kappa-opioid receptor mRNA differential transport in neurons.Mol Pharmacol. 2003 Sep;64(3):594-9. doi: 10.1124/mol.64.3.594. Mol Pharmacol. 2003. PMID: 12920195
-
The RNA superhighway: axonal RNA trafficking of kappa opioid receptor mRNA for neurite growth.Integr Biol (Camb). 2011 Jan;3(1):10-6. doi: 10.1039/c0ib00107d. Epub 2010 Nov 29. Integr Biol (Camb). 2011. PMID: 21116543 Review.
-
Expression of mu-, delta-, and kappa-opioid receptor-like immunoreactivities in rat dorsal root ganglia after carrageenan-induced inflammation.J Neurosci. 1995 Dec;15(12):8156-66. doi: 10.1523/JNEUROSCI.15-12-08156.1995. J Neurosci. 1995. PMID: 8613750 Free PMC article.
-
Dynamics of axonal mRNA transport and implications for peripheral nerve regeneration.Exp Neurol. 2010 May;223(1):19-27. doi: 10.1016/j.expneurol.2009.08.011. Epub 2009 Aug 20. Exp Neurol. 2010. PMID: 19699200 Free PMC article. Review.
Cited by
-
Golgi Fragmentation in ALS Motor Neurons. New Mechanisms Targeting Microtubules, Tethers, and Transport Vesicles.Front Neurosci. 2015 Dec 8;9:448. doi: 10.3389/fnins.2015.00448. eCollection 2015. Front Neurosci. 2015. PMID: 26696811 Free PMC article. Review.
-
Novel mechanisms in the regulation of G protein-coupled receptor trafficking to the plasma membrane.J Biol Chem. 2010 Oct 29;285(44):33816-25. doi: 10.1074/jbc.M110.168229. Epub 2010 Aug 25. J Biol Chem. 2010. PMID: 20739277 Free PMC article.
-
Dual action of epidermal growth factor: extracellular signal-stimulated nuclear-cytoplasmic export and coordinated translation of selected messenger RNA.J Cell Biol. 2010 Feb 8;188(3):325-33. doi: 10.1083/jcb.200910083. J Cell Biol. 2010. PMID: 20142421 Free PMC article.
-
α-COP binding to the survival motor neuron protein SMN is required for neuronal process outgrowth.Hum Mol Genet. 2015 Dec 20;24(25):7295-307. doi: 10.1093/hmg/ddv428. Epub 2015 Oct 13. Hum Mol Genet. 2015. PMID: 26464491 Free PMC article.
-
Epigenetic regulation of kappa opioid receptor gene in neuronal differentiation.Neuroscience. 2008 Feb 19;151(4):1034-41. doi: 10.1016/j.neuroscience.2007.12.015. Epub 2008 Jan 16. Neuroscience. 2008. PMID: 18201839 Free PMC article.
References
-
- Goldstein A, Naidu A. Mol Pharmacol. 1989;36:256–272. - PubMed
-
- Pasternak GW. Neuropharmacology. 2004;47(Suppl 1):312–323. - PubMed
-
- Law PY, Erickson LJ, El-Kouhen R, Dicker L, Solberg J, Wang W, Miller E, Burd AL, Loh HH. Mol Pharmacol. 2000;58:388–398. - PubMed
-
- Schoffelmeer AN, Rice KC, Jacobson AE, Van Geleren JG, Hogenboom F, Heijna MH, Mulder AH. Eur J Pharmacol. 1988;154:169–178. - PubMed
Publication types
MeSH terms
Substances
Grants and funding
- DA00564/DA/NIDA NIH HHS/United States
- DA01583/DA/NIDA NIH HHS/United States
- R01 DK060521/DK/NIDDK NIH HHS/United States
- R01 DA000564/DA/NIDA NIH HHS/United States
- K02 DA13926/DA/NIDA NIH HHS/United States
- P50 DA011806/DA/NIDA NIH HHS/United States
- R56 DA000564/DA/NIDA NIH HHS/United States
- DA11190/DA/NIDA NIH HHS/United States
- DK54733/DK/NIDDK NIH HHS/United States
- R01 DA001583/DA/NIDA NIH HHS/United States
- DK60521/DK/NIDDK NIH HHS/United States
- K02 DA013926/DA/NIDA NIH HHS/United States
- R01 DA011190/DA/NIDA NIH HHS/United States
- R01 DK054733/DK/NIDDK NIH HHS/United States
- K05 DA070554/DA/NIDA NIH HHS/United States
- K05-DA70554/DA/NIDA NIH HHS/United States
- DA11806/DA/NIDA NIH HHS/United States
LinkOut - more resources
Full Text Sources
Molecular Biology Databases
