

Empirical evidence for a recent slowdown in irrigation-induced cooling
- PMID: 17698963
- PMCID: PMC1959424
- DOI: 10.1073/pnas.0700144104
Empirical evidence for a recent slowdown in irrigation-induced cooling
Abstract
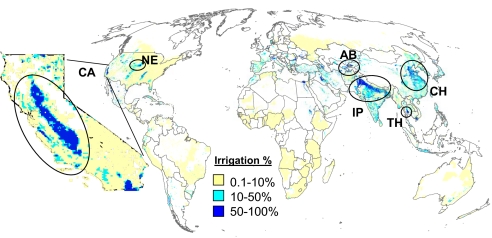
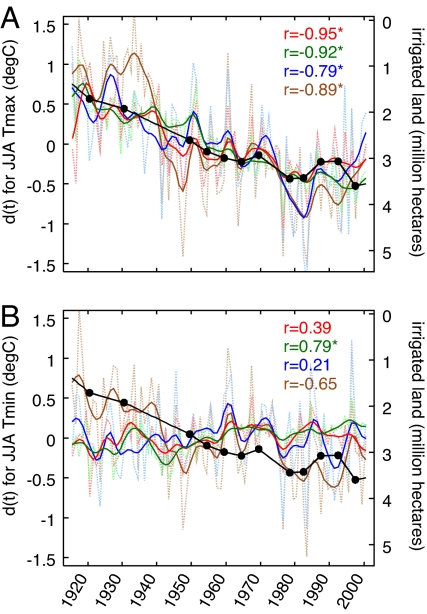
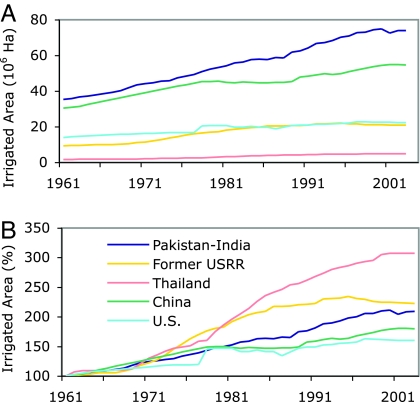
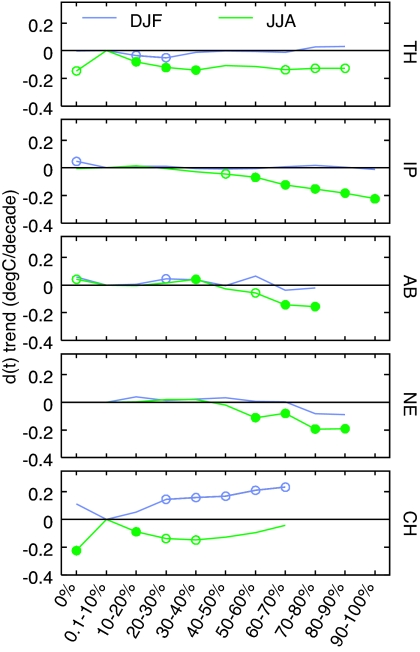
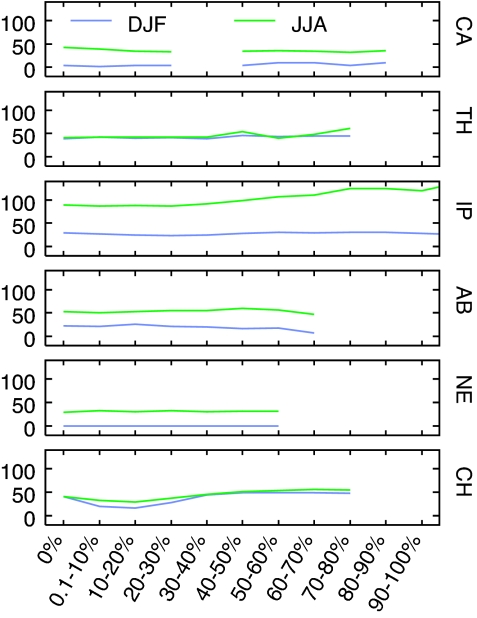
Understanding the influence of past land use changes on climate is needed to improve regional projections of future climate change and inform debates about the tradeoffs associated with land use decisions. The effects of rapid expansion of irrigated area in the 20th century has remained unclear relative to other land use changes, such as urbanization, that affected a similar total land area. Using spatial and temporal variations in temperature and irrigation extent observed in California, we show that irrigation expansion has had a large cooling effect on summertime average daily daytime temperatures (-0.14 degrees C to -0.25 degrees C per decade), which corresponds to an estimated cooling of -1.8 degrees C to -3.2 degrees C since the introduction of irrigation practices. Irrigation has negligible effects on nighttime temperatures, leading to a net cooling effect of irrigation on climate (-0.06 degrees C to -0.19 degrees C per decade). Stabilization of irrigated area has occurred in California since 1980 and is expected in the near future for many irrigated regions. The suppression of past human-induced greenhouse warming by increased irrigation is therefore likely to slow in the future, and a potential decrease in irrigation may even contribute to a more rapid warming. Changes in irrigation alone are not expected to influence broad-scale temperatures, but they may introduce large uncertainties in climate projections for irrigated agricultural regions, which provide approximately 40% of global food production.
Conflict of interest statement
The authors declare no conflict of interest.
Figures
References
-
- Forster P, Ramaswamy V, Artaxo P, Berntsen T, Betts R, Fahey DW, Haywood J, Lean J, Lowe DC, Myhre G, et al. In: Changes in Atmospheric Constituents and in Radiative Forcing in: Climate Change 2007: The Physical Science Basis. Contribution of Working Group I to the Fourth Assessment Report of the Intergovernmental Panel on Climate Change. Solomon S, Qin D, Manning M, Chen Z, Marquis M, Averyt KB, Tignor M, Miller HL, editors. Cambridge, UK: Cambridge Univ Press; 2007. pp. 129–234.
-
- Feddema JJ, Oleson KW, Bonan GB, Mearns LO, Buja LE, Meehl GA, Washington WM. Science. 2005;310:1674–1678. - PubMed
-
- Foley JA, DeFries R, Asner GP, Barford C, Bonan G, Carpenter SR, Chapin FS, Coe MT, Daily GC, Gibbs HK, et al. Science. 2005;309:570–574. - PubMed
-
- Govindasamy B, Duffy PB, Caldeira Geophys Res Lett. 2001;28:291–294.
-
- Grübler A. In: Changes in Land Use and Land Cover: A Global Perspective. Meyer WB, Turner BL II, editors. Cambridge, UK: Cambridge Univ Press; 1994. pp. 287–328.
Publication types
MeSH terms
LinkOut - more resources
Full Text Sources
Miscellaneous
