. 2007 Aug 21;104(34):13711-6.
doi: 10.1073/pnas.0611630104. Epub 2007 Aug 14.

Varying environments can speed up evolution

Affiliations

Varying environments can speed up evolution

Nadav Kashtan et al. Proc Natl Acad Sci U S A. .

Abstract

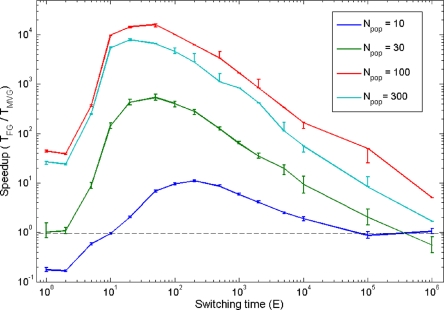
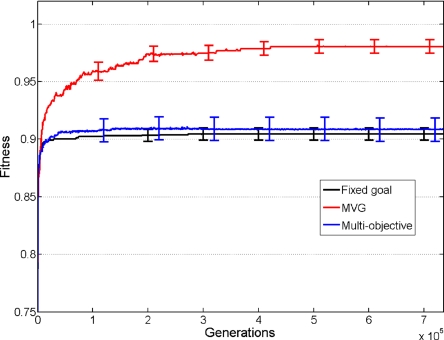
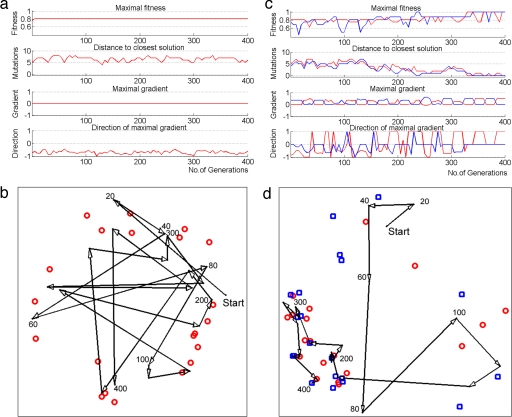
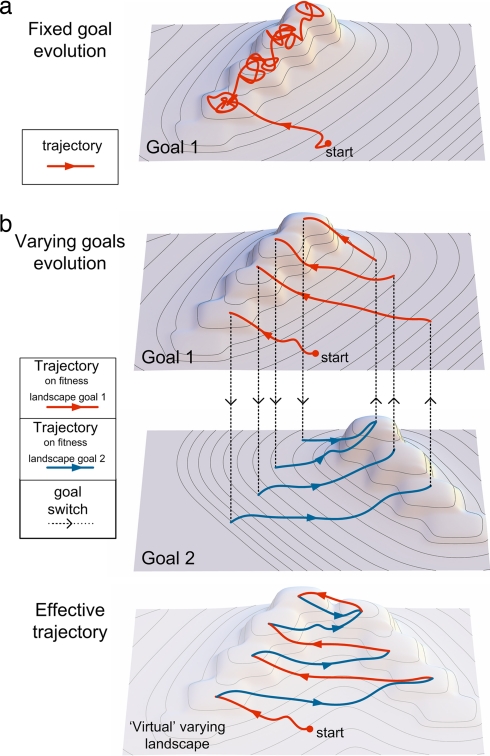
Simulations of biological evolution, in which computers are used to evolve systems toward a goal, often require many generations to achieve even simple goals. It is therefore of interest to look for generic ways, compatible with natural conditions, in which evolution in simulations can be speeded. Here, we study the impact of temporally varying goals on the speed of evolution, defined as the number of generations needed for an initially random population to achieve a given goal. Using computer simulations, we find that evolution toward goals that change over time can, in certain cases, dramatically speed up evolution compared with evolution toward a fixed goal. The highest speedup is found under modularly varying goals, in which goals change over time such that each new goal shares some of the subproblems with the previous goal. The speedup increases with the complexity of the goal: the harder the problem, the larger the speedup. Modularly varying goals seem to push populations away from local fitness maxima, and guide them toward evolvable and modular solutions. This study suggests that varying environments might significantly contribute to the speed of natural evolution. In addition, it suggests a way to accelerate optimization algorithms and improve evolutionary approaches in engineering.


Conflict of interest statement

The authors declare no conflict of interest.

Figures

Fig. 1.
Fig. 1.
Evolution speedup under varying goals. The five panels show the speedup of different model systems. Each graph describes the speedup of evolution under MVG compared with fixed goal, versus the median time to evolve under a fixed goal (TFG). Each point represents the speedup, S = TFG /TMVG, for a given goal. (a) Model 1: general logic circuits. (b) Model 2: feed-forward logic circuits. (c) Model 3: feed-forward neural networks. (d) Model 4: continuous function circuits. (e) Model 5: RNA secondary structure. Speedup scales approximately as a power law with exponents in the range α = 0.7 to α = 1.0. T0 is the minimal TFG value to yield S > 1 (based on regression). SEs were computed by using the bootstrap method.
Fig. 2.
Fig. 2.
Effect of frequency of goal switches on speedup. Speedup (±SE) is shown under different frequencies of goal switches and with various population sizes (Npop). Results are for goal G1 = (x XOR y) OR (w XOR z), using a small version of model 2, with 4-input and 1-output goals (see Methods). In the MVG scenario, the goal switched between G1 and G2 = (x XOR y) AND (w XOR z) every E generations. The dashed line represents a speedup of S = 1.
Fig. 3.
Fig. 3.
Fitness as a function of time in MVG, fixed goal and multiobjective scenarios. Maximal fitness in the population (mean ± SE) as a function of generations for a 4-input version of model 1 for the goal G1 = (x XOR y) AND (w XOR z). For the MVG and multiobjective case, the second goal was G2 = (x XOR y) OR (w XOR z). For MVG, data are for epochs where the goal was G1. For multiobjective evolution, in which two outputs from the network were evaluated for G1 and G2, fitness of the G1 output is shown. Data are from 40 simulations in each case.
Fig. 4.
Fig. 4.
Trajectories and fitness landscapes in fixed goal and MVG evolution. (a) A typical evolution simulation in a small version of model 2, toward the fixed goal G1 = (x XOR y) OR (w XOR z). Shown are properties of the best network in the population at each generation during simulation: fitness; distance to closest solution (the required number of mutations to reach the closest solution); maximal fitness gradient; and average direction of the maximal gradient. −1, away from the closest solution; +1, toward the closest solution. (b) The trajectory of the fittest network, shown every 20 generations (arrowheads). The trajectory was mapped to two-dimensions by means of multidimensional scaling (44), a technique that arranges points in a low dimension space while best preserving their original distances in a high-dimension space (the 38-dimensional genome space where each axis corresponds to one bit in the genome). Red circles describe the closest solutions. Numbers represent generations. (c) Same as in a but for evolution toward MGV, switching between G1 and G2 = (x XOR y) AND (w XOR z) every 20 generations. Properties of best circuit under goal G1 and G2 are in red and blue, respectively. (d) Trajectory of evolution under MVG. Red circles describe the closest G1 solutions, and blue squares describe the closest G2 solutions.
Fig. 5.
Fig. 5.
A schematic view of fitness landscapes and evolution under fixed goal and MVG. (a) A typical trajectory under fixed goal evolution. The population tends to spend long periods on local maxima or plateaus. (b) A typical trajectory under MVG. Dashed arrows represent goal switches. An effectively continuous positive gradient on the alternating fitness landscapes leads to an area where global maxima exist in close proximity for both goals.

References

    1. Kirschner M, Gerhart JC. The Plausibility of Life: Resolving Darwin's Dilemma. London: Yale Univ Press; 2005.
    1. Eldredge N, Gould SJ. Science. 1997;276:338–341. - PubMed
    1. Elena SF, Cooper VS, Lenski RE. Science. 1996;272:1802–1804. - PubMed
    1. Gerhart J, Kirschner M. Cells, Embryos, and Evolution: Toward a Cellular and Developmental Understanding of Phenotypic Variation and Evolutionary Adaptability. Oxford: Blackwell; 1997.
    1. Springer MS, Murphy WJ, Eizirik E, O'Brien SJ. Proc Natl Acad Sci USA. 2003;100:1056–1061. - PMC - PubMed

Publication types

LinkOut - more resources