

Ataxia telangiectasia-mutated dependent DNA damage checkpoint functions regulate gene expression in human fibroblasts
- PMID: 17699107
- PMCID: PMC3607384
- DOI: 10.1158/1541-7786.MCR-07-0104
Ataxia telangiectasia-mutated dependent DNA damage checkpoint functions regulate gene expression in human fibroblasts
Abstract
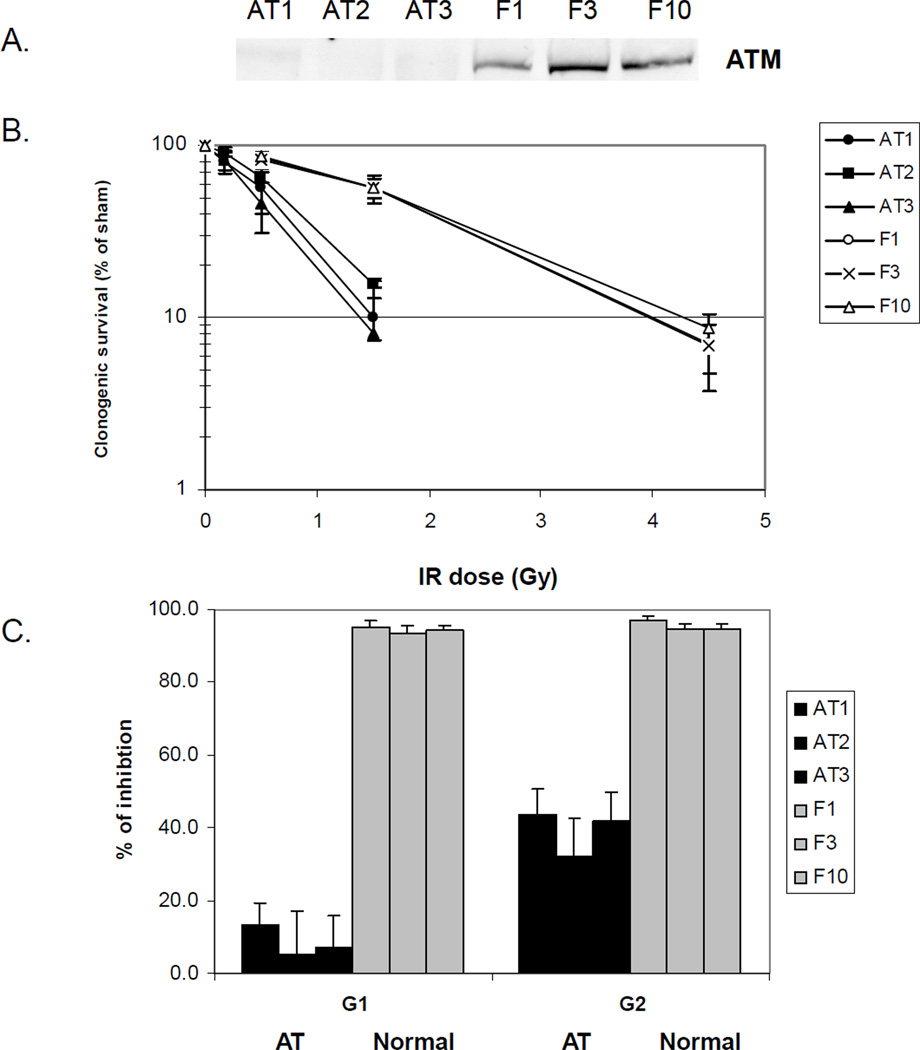
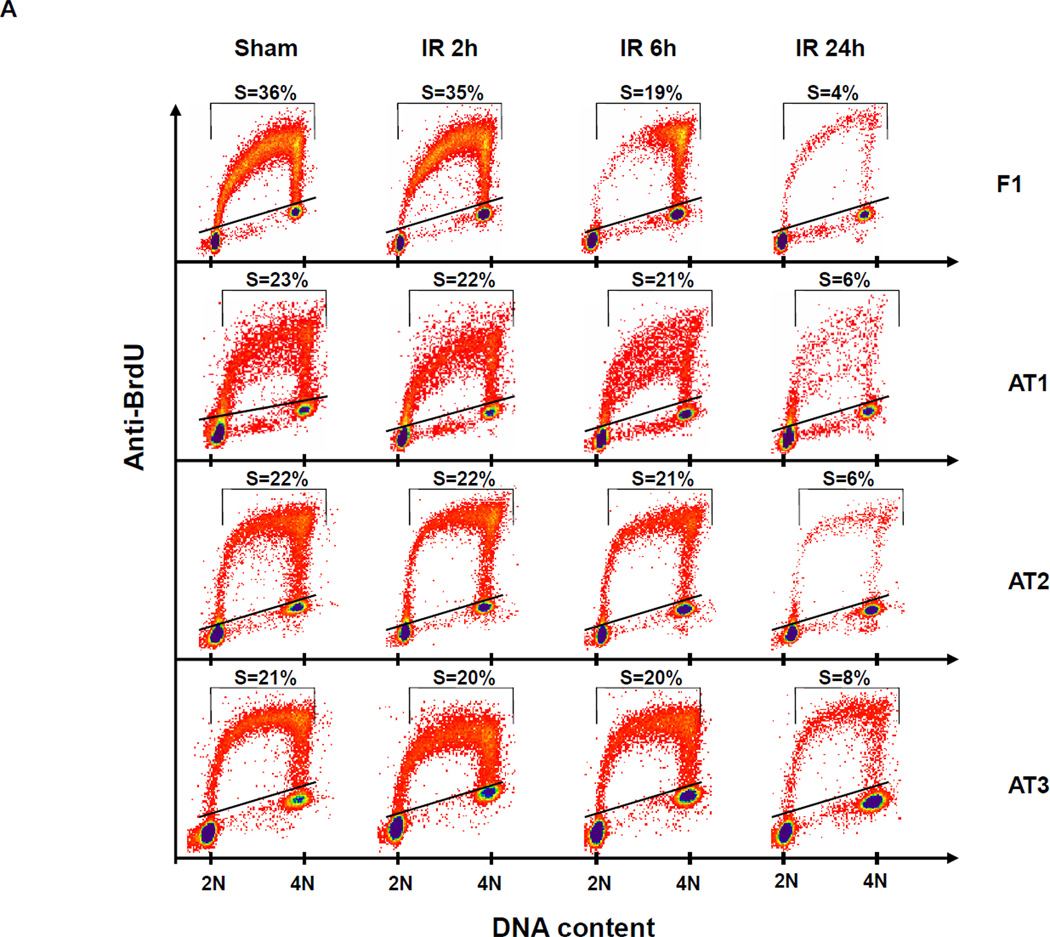
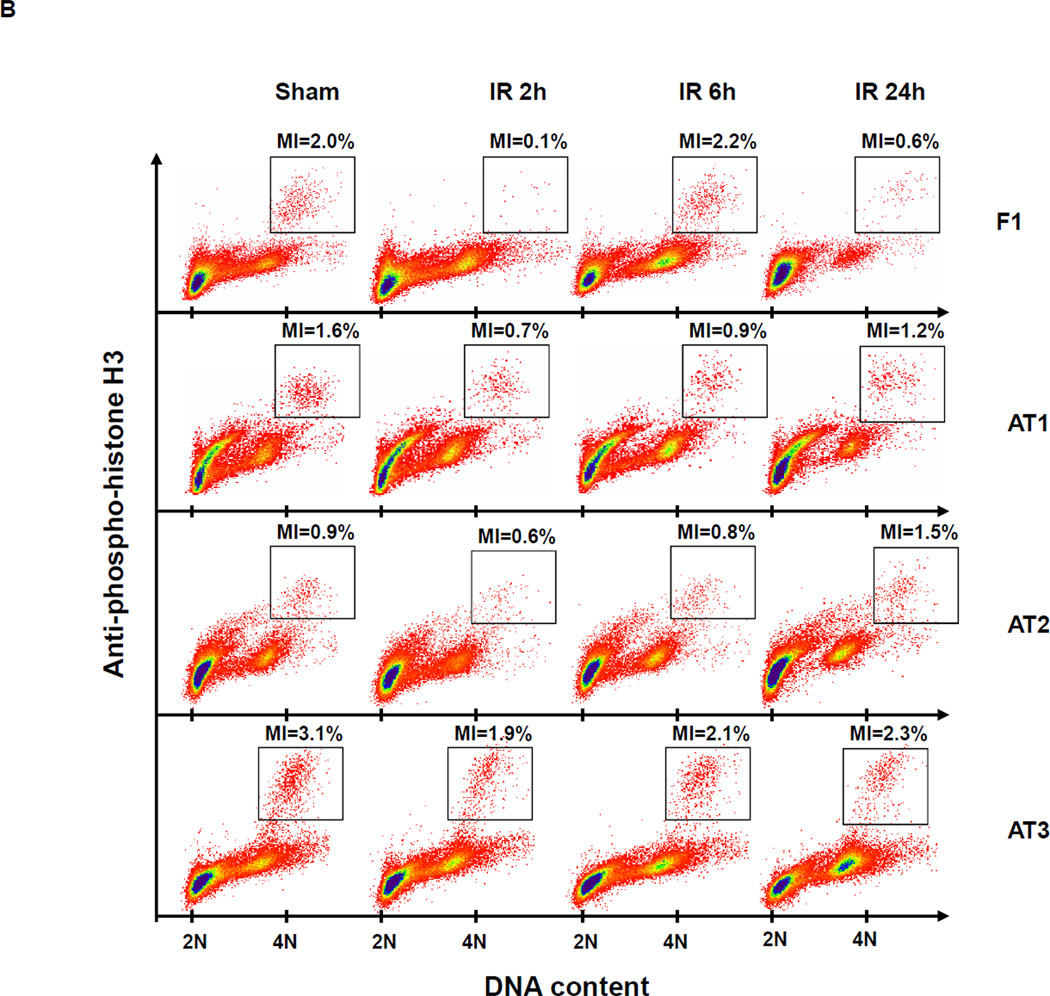
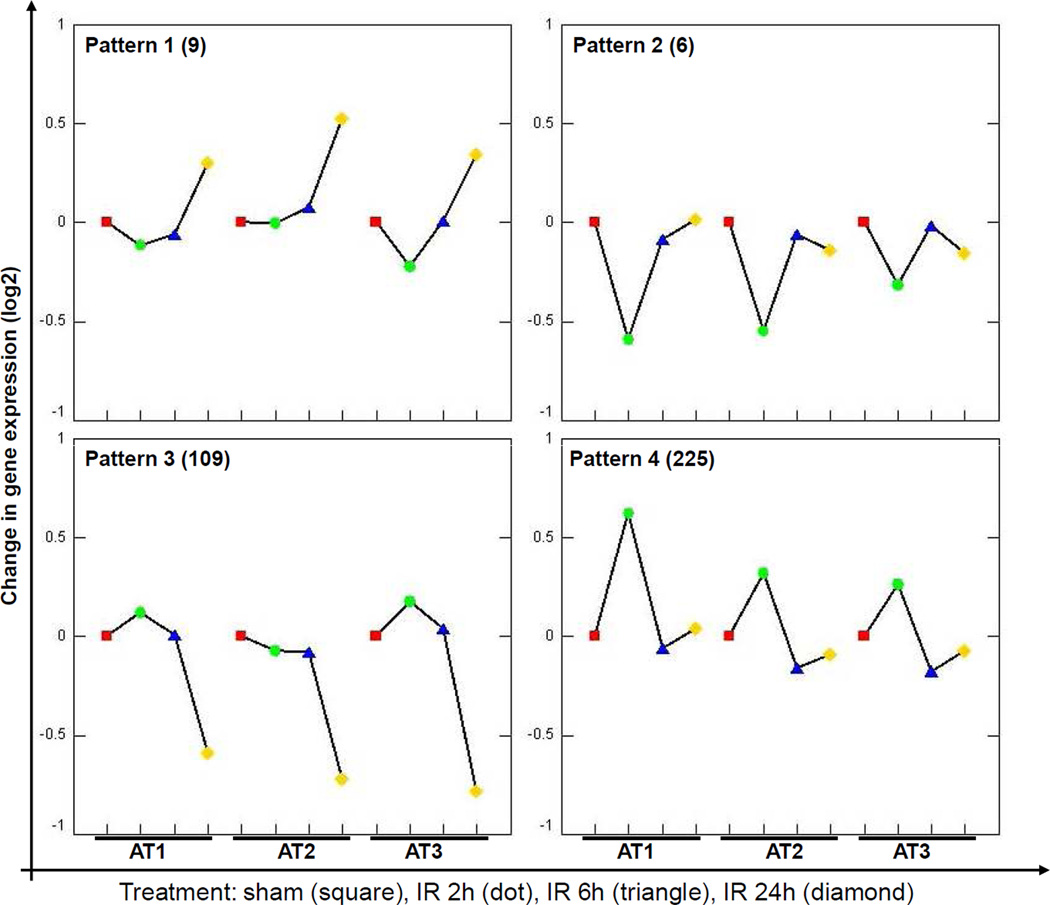
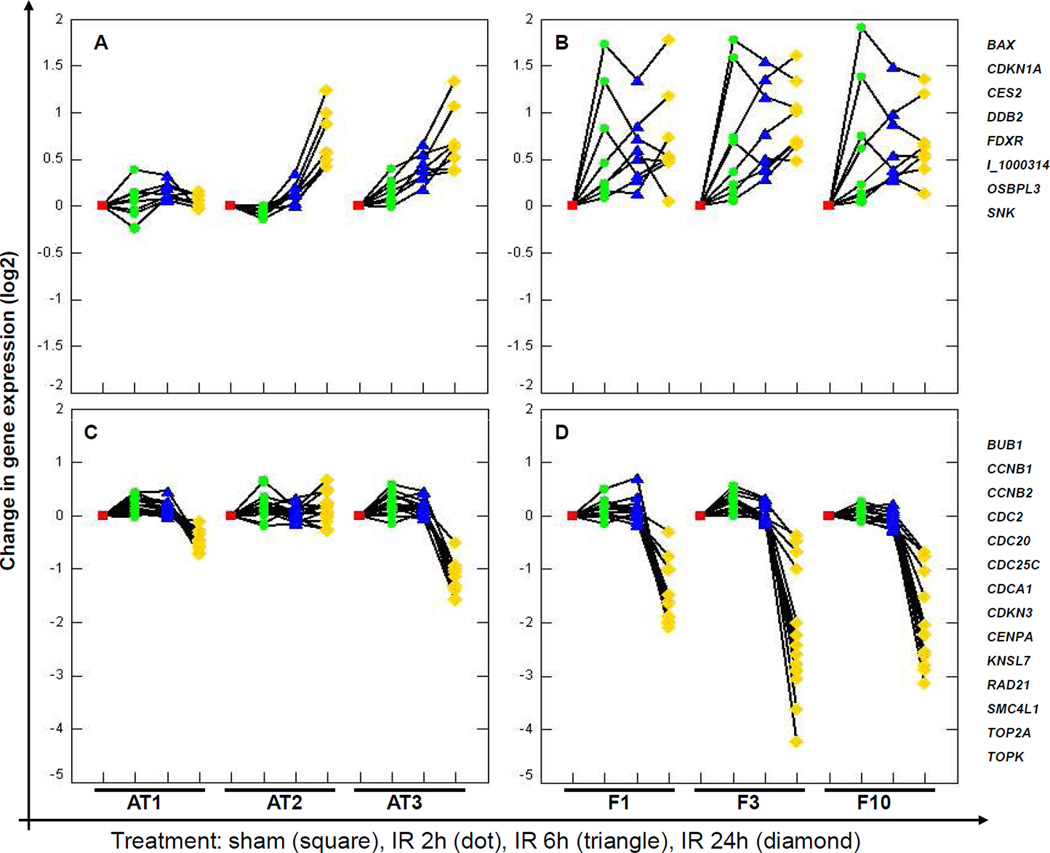
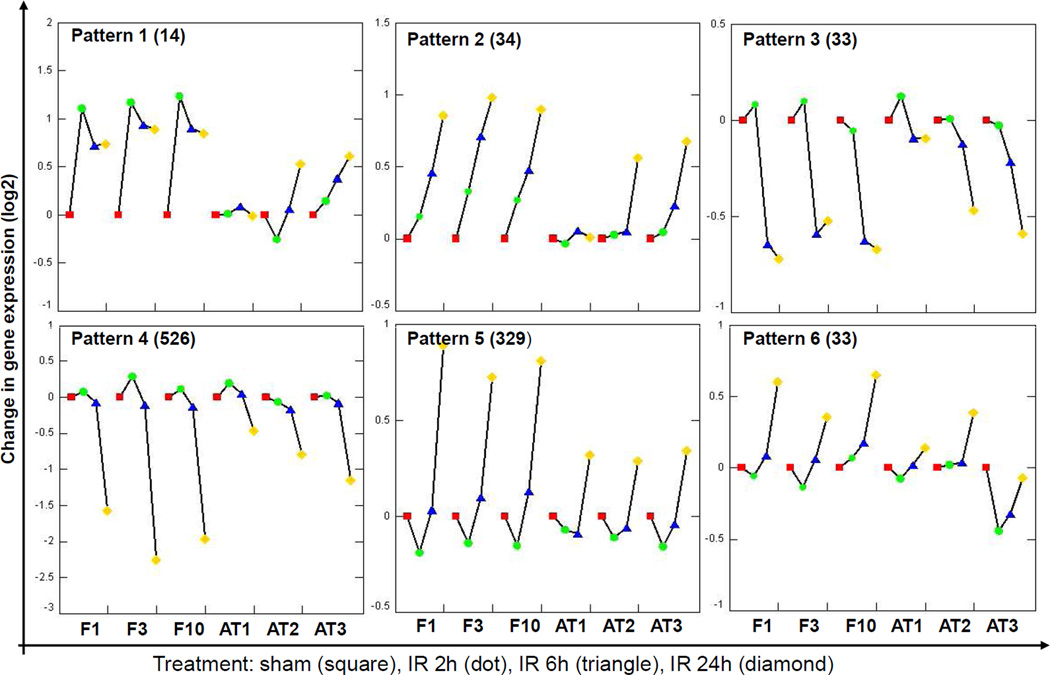
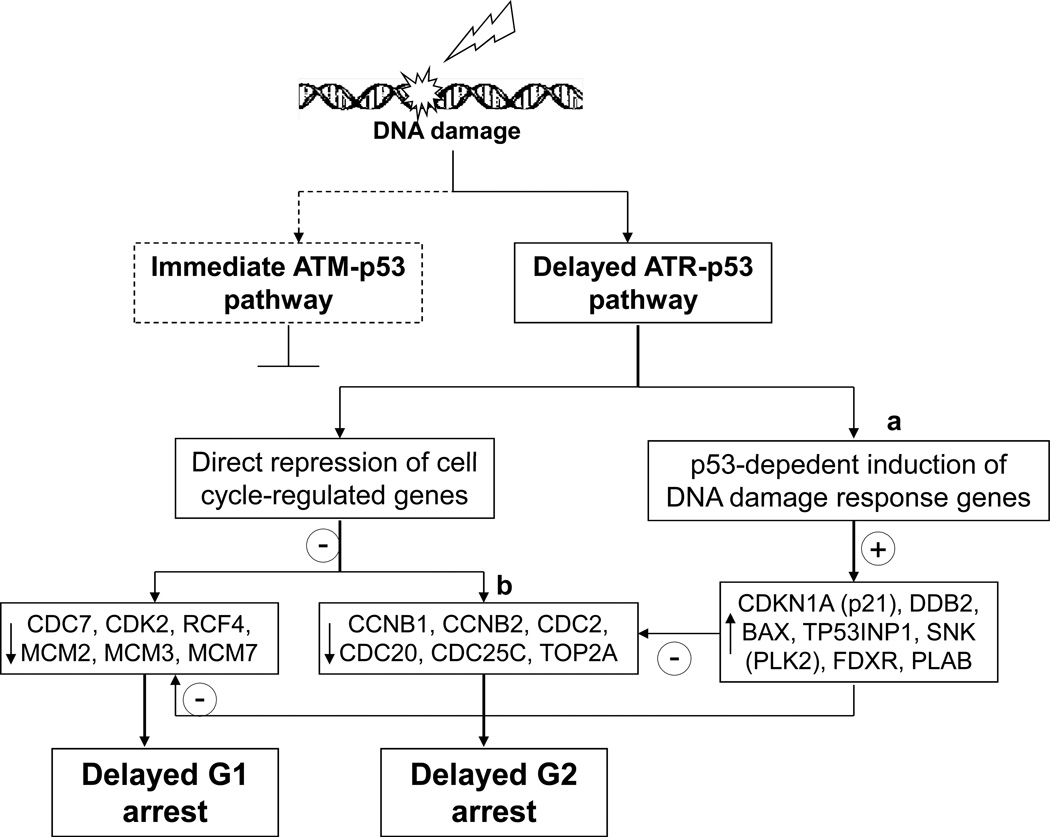
The relationships between profiles of global gene expression and DNA damage checkpoint functions were studied in cells from patients with ataxia telangiectasia (AT). Three telomerase-expressing AT fibroblast lines displayed the expected hypersensitivity to ionizing radiation (IR) and defects in DNA damage checkpoints. Profiles of global gene expression in AT cells were determined at 2, 6, and 24 h after treatment with 1.5-Gy IR or sham treatment and were compared with those previously recognized in normal human fibroblasts. Under basal conditions, 160 genes or expressed sequence tags were differentially expressed in AT and normal fibroblasts, and these were associated by gene ontology with insulin-like growth factor binding and regulation of cell growth. On DNA damage, 1,091 gene mRNAs were changed in at least two of the three AT cell lines. When compared with the 1,811 genes changed in normal human fibroblasts after the same treatment, 715 were found in both AT and normal fibroblasts, including most genes categorized by gene ontology into cell cycle, cell growth, and DNA damage response pathways. However, the IR-induced changes in these 715 genes in AT cells usually were delayed or attenuated in comparison with normal cells. The reduced change in DNA damage response genes and the attenuated repression of cell cycle-regulated genes may account for the defects in cell cycle checkpoint function in AT cells.
Figures
Similar articles
-
Functional interaction of H2AX, NBS1, and p53 in ATM-dependent DNA damage responses and tumor suppression.Mol Cell Biol. 2005 Jan;25(2):661-70. doi: 10.1128/MCB.25.2.661-670.2005. Mol Cell Biol. 2005. PMID: 15632067 Free PMC article.
-
Dissecting cellular responses to irradiation via targeted disruptions of the ATM-CHK1-PP2A circuit.Cell Cycle. 2013 Apr 1;12(7):1105-18. doi: 10.4161/cc.24127. Epub 2013 Mar 5. Cell Cycle. 2013. PMID: 23462183 Free PMC article.
-
Growth of persistent foci of DNA damage checkpoint factors is essential for amplification of G1 checkpoint signaling.DNA Repair (Amst). 2008 Mar 1;7(3):405-17. doi: 10.1016/j.dnarep.2007.11.011. Epub 2008 Jan 8. DNA Repair (Amst). 2008. PMID: 18248856
-
Ataxia-telangiectasia mutated kinase (ATM) as a central regulator of radiation-induced DNA damage response.Acta Medica (Hradec Kralove). 2010;53(1):13-7. doi: 10.14712/18059694.2016.57. Acta Medica (Hradec Kralove). 2010. PMID: 20608227 Review.
-
The NBS1-ATM connection revisited.Cell Cycle. 2007 Oct 1;6(19):2366-70. doi: 10.4161/cc.6.19.4758. Epub 2007 Jul 18. Cell Cycle. 2007. PMID: 17881893 Review.
Cited by
-
A prognostic signature of defective p53-dependent G1 checkpoint function in melanoma cell lines.Pigment Cell Melanoma Res. 2012 Jul;25(4):514-26. doi: 10.1111/j.1755-148X.2012.01010.x. Epub 2012 Jun 1. Pigment Cell Melanoma Res. 2012. PMID: 22540896 Free PMC article.
-
Gene expression signatures but not cell cycle checkpoint functions distinguish AT carriers from normal individuals.Physiol Genomics. 2013 Oct 1;45(19):907-16. doi: 10.1152/physiolgenomics.00064.2013. Epub 2013 Aug 13. Physiol Genomics. 2013. PMID: 23943852 Free PMC article.
-
Development of a prediction model for radiosensitivity using the expression values of genes and long non-coding RNAs.Oncotarget. 2016 May 3;7(18):26739-50. doi: 10.18632/oncotarget.8496. Oncotarget. 2016. PMID: 27050376 Free PMC article.
-
Revised genetic requirements for the decatenation G2 checkpoint: the role of ATM.Cell Cycle. 2010 Apr 15;9(8):1617-28. doi: 10.4161/cc.9.8.11470. Epub 2010 Apr 15. Cell Cycle. 2010. PMID: 20372057 Free PMC article.
-
Ionizing radiation induced signaling of DNA damage response molecules in RAW 264.7 and CD4⁺ T cells.Mol Cell Biochem. 2012 Apr;363(1-2):43-51. doi: 10.1007/s11010-011-1156-z. Epub 2011 Dec 16. Mol Cell Biochem. 2012. PMID: 22173400
References
-
- Abraham RT. Cell cycle checkpoint signaling through the ATM and ATR kinases. Genes Dev. 2001;15(17):2177–2196. - PubMed
-
- Shiloh Y. ATM and ATR: networking cellular responses to DNA damage. Curr Opin Genet Dev. 2001;11(1):71–77. - PubMed
-
- Baross A, Schertzer M, Zuyderduyn SD, Jones SJ, Marra MA, Lansdorp PM. Effect of TERT and ATM on gene expression profiles in human fibroblasts. Genes Chromosomes Cancer. 2004;39(4):298–310. - PubMed
-
- Bakkenist CJ, Kastan MB. DNA damage activates ATM through intermolecular autophosphorylation and dimer dissociation. Nature. 2003;421(6922):499–506. - PubMed
-
- Concannon P, Gatti RA. Diversity of ATM gene mutations detected in patients with ataxia-telangiectasia. Hum Mutat. 1997;10(2):100–107. - PubMed
Publication types
MeSH terms
Substances
Grants and funding
LinkOut - more resources
Full Text Sources
Molecular Biology Databases
Research Materials
Miscellaneous
