. 2007 Nov;81(21):11957-71.
doi: 10.1128/JVI.00111-07. Epub 2007 Aug 15.

ORF73-null murine gammaherpesvirus 68 reveals roles for mLANA and p53 in virus replication

Affiliations

ORF73-null murine gammaherpesvirus 68 reveals roles for mLANA and p53 in virus replication

J Craig Forrest et al. J Virol. 2007 Nov.

Abstract

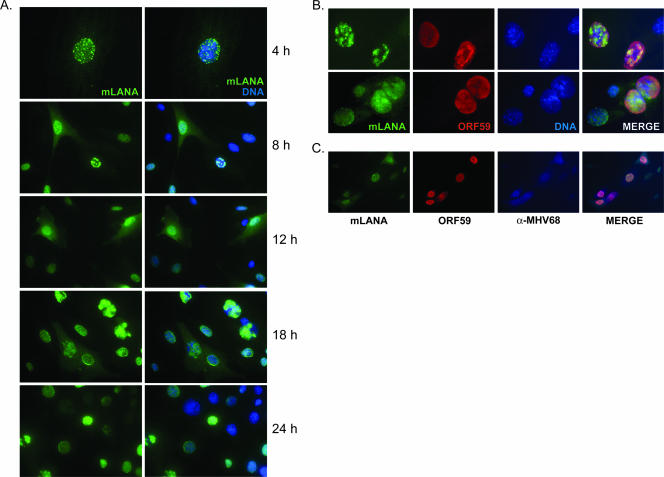
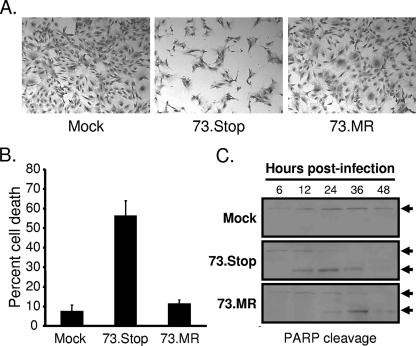
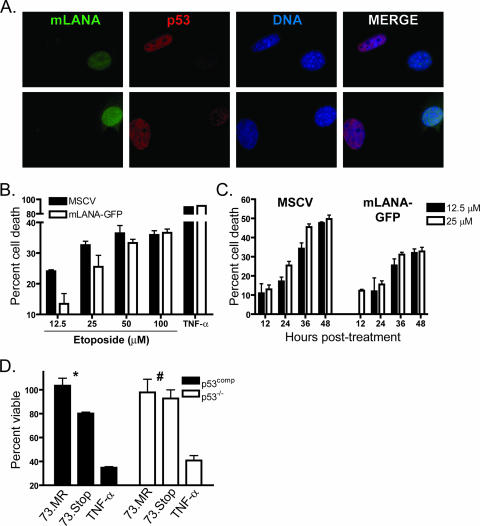
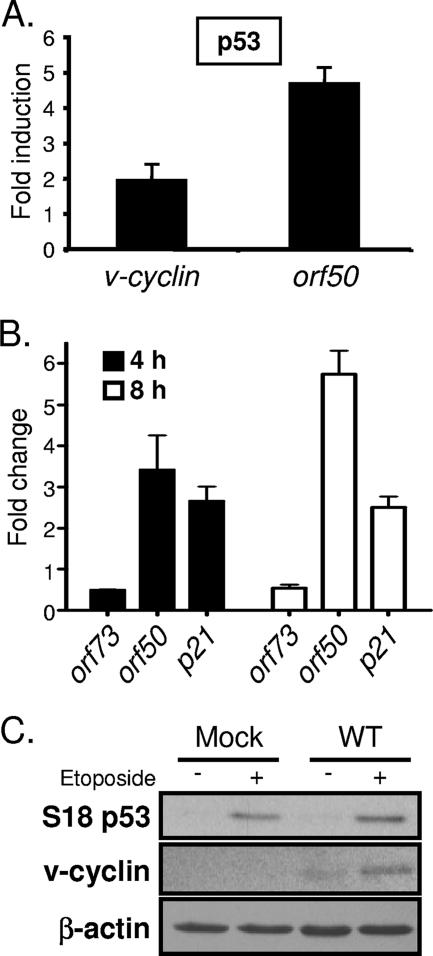
Gammaherpesviruses establish lifelong, latent infections in host lymphocytes, during which a limited subset of viral gene products facilitates maintenance of the viral episome. Among the gamma-2-herpesvirus (rhadinovirus) subfamily, this includes expression of the conserved ORF73-encoded LANA proteins. We previously demonstrated by loss-of-function mutagenesis that the murine gammaherpesvirus 68 (MHV68) ORF73 gene product, mLANA, is required for the establishment of latency following intranasal inoculation of mice (N. J. Moorman, D. O. Willer, and S. H. Speck, J. Virol. 77:10295-10303, 2003). mLANA-deficient viruses also exhibited a defect in acute virus replication in the lungs of infected mice. The latter observation led us to examine the role of mLANA in productive viral replication. We assessed the capacity of mLANA-deficient virus (73.Stop) to replicate in cell culture at low multiplicities of infection (MOIs) and found that 73.Stop growth was impaired in murine fibroblasts but not in Vero cells. A recombinant virus expressing an mLANA-green fluorescent protein (GFP) fusion revealed that mLANA is expressed throughout the virus replication cycle. In addition, 73.Stop infection of murine fibroblasts at high MOIs was substantially more cytotoxic than infection with a genetically repaired marker rescue virus (73.MR), a phenotype that correlated with enhanced kinetics of viral gene expression and increased activation of p53. Notably, augmented cell death, viral gene expression, and p53 induction were independent of viral DNA replication. Expression of a mLANA-GFP fusion protein in fibroblasts correlated with both reduced p53 stabilization and reduced cell death following treatment with p53-inducing agonists. In agreement, accentuated cell death associated with 73.Stop infection was reduced in p53-deficient murine embryonic fibroblasts. Additionally, replication of 73.Stop in p53-deficient cells was restored to levels comparable to those of 73.MR. More remarkably, the absence of p53 led to an overall delay in replication for both 73.Stop and 73.MR viruses, which correlated with delayed viral gene expression, indicating a role for p53 in MHV68 replication. Consistent with these findings, the expression of replication-promoting viral genes was positively influenced by p53 overexpression or treatment with the p53 agonist etoposide. Overall, these data demonstrate the importance of mLANA in MHV68 replication and suggest that LANA proteins limit the induction of cellular stress responses to regulate the viral gene expression cascade and limit host cell injury.


Figures

FIG. 1.
FIG. 1.
mLANA promotes efficient viral replication in primary murine fibroblasts. Vero cells (A), MEFs (B and C), or NIH 3T3 fibroblasts (D) were infected with 73.Stop or 73.MR virus at an MOI of 0.05 (A and B) or 0.001 PFU/cell (C and D). Cells were harvested at the indicated times postinfection, and viral titers were determined by plaque assay. Results are the means of triplicate samples. Error bars represent standard deviations.
FIG. 2.
FIG. 2.
mLANA is a nuclear/cytoplasmic protein expressed during lytic replication. NIH 3T3 fibroblasts were infected with recombinant MHV68-73GFP at an MOI of 10 PFU/cell. (A) Cells were fixed at the indicated times postinfection and were stained with GFP-directed antiserum to visualize mLANA-GFP subcellular localization by fluorescence microscopy. (B and C) Cells were stained with antibodies to GFP or ORF59 18 h postinfection (B) or GFP, ORF59, and MHV68 antiserum 24 h postinfection (C). DNA was stained with DAPI (A) or Hoechst 33342 (B). The images in panel A at 4 h and in panel B were captured at ×100 magnification. All other images were captured at ×40 magnification.
FIG. 3.
FIG. 3.
mLANA-deficient virus exhibits increased kinetics of cell death and PARP cleavage. (A and B) NIH 3T3 fibroblasts were mock infected or were infected with 73.Stop or 73.MR virus at an MOI of 2 PFU/cell and were harvested 24 h postinfection. (A) Representative images of cells that were fixed and stained with crystal violet for imaging by light microscopy. (B) Cell viability of triplicate samples determined by trypan blue exclusion. A minimum of 200 cells was counted per sample. Results are the means of triplicate samples. Error bars represent standard deviations. (C) NIH 3T3 fibroblasts were mock infected or were infected with 73.Stop or 73.MR virus at an MOI of 2 PFU/cell and were harvested at the indicated times postinfection. Equivalent amounts of total protein were resolved by SDS-PAGE, and the integrity of PARP was determined by immunoblotting. Arrows denote intact (upper) or cleaved (lower) PARP.
FIG. 4.
FIG. 4.
73.Stop virus exhibits increased replication, viral antigen expression, and p53 induction. (A) MEFs were infected with 73.Stop or 73.MR virus at an MOI of 2 PFU/cell, and cells were harvested at the indicated times postinfection. Viral yields were determined by plaque assay. Results are the means from triplicate samples. Error bars represent standard deviations. P values were determined using a two-tailed paired Student's t test. (B) NIH 3T3 fibroblasts were infected with 73.Stop or 73.MR virus at an MOI of 2 PFU/cell. Equivalent numbers of cells were harvested directly by addition of Laemmli sample buffer at the indicated times postinfection. Total cell lysates were resolved by SDS-PAGE and were analyzed by immunoblotting with antibodies to the indicated proteins. Untreated and UV-exposed cells (100 J/m2) serve as negative and positive controls, respectively, for p53 stabilization and activation. The blot shown is representative of three independent experiments.
FIG. 5.
FIG. 5.
73.Stop-induced cell death, p53 phosphorylation, and dysregulated early gene expression occur independently of viral replication. (A to C) NIH 3T3 fibroblasts were mock infected, infected with 73.Stop or 73.MR virus at MOIs of 2 to 20 PFU/cell in the presence of 20 ng/ml cidofovir (A and B), or infected with 50.Stop virus at MOIs of 2 to 20 PFU/cell (C). (A) Representative images of cells that were fixed and stained with crystal violet 24 h after infection for imaging by light microscopy. (B) Cell viability determined by trypan blue exclusion 26 h after infection. A minimum of 200 cells per sample was counted. Results are the means from triplicate samples. Error bars represent standard deviations. (C) NIH 3T3 fibroblasts were mock infected or were infected with 73.Stop or 73.MR virus in the presence or absence of 20 ng/ml cidofovir at an MOI of 2 PFU/cell. Equivalent numbers of cells were harvested directly by addition of Laemmli sample buffer 6 h postinfection. Total cell lysates were resolved by SDS-PAGE and were analyzed by immunoblotting with antibodies to the indicated proteins. UV-exposed cells (100 J/m2) serve as a positive control for p53 activation. The blot shown is representative of three independent experiments.
FIG. 6.
FIG. 6.
mLANA inhibits p53 induction and reduces etoposide-induced cell death. (A) mLANA-GFP-transduced NIH 3T3 fibroblasts were treated with etoposide (100 μM). Cells were fixed and stained for p53 4 h posttreatment. Two representative images are shown at ×100 magnification. (B and C) Empty vector (MSCV) or mLANA-GFP-transduced NIH 3T3 fibroblasts were treated with etoposide at the indicated concentrations. Cell viability was analyzed 28 h posttreatment (B) or during a time course (C). Data are presented as the percentages of cell death with treatment relative to that for mock-treated controls. Results are the means from triplicate samples. Error bars represent standard deviations. (D) p53comp or p53−/− MEFs were infected with 73.Stop or 73.MR virus at an MOI of 2 PFU/cell in the presence of 20 ng/ml cidofovir. Cell viability was determined 12 h postinfection. Data represent the percentages of cell death relative to that for mock-infected samples. Results are the means from triplicate samples. Error bars represent standard errors of the means. Statistical analyses of differences for 73.MR- and 73.Stop-infected cells were performed using a two-tailed paired Student's t test (*, P = 0.05; #, P = 0.66). (B and D) Tumor necrosis factor alpha (TNF-α) samples were treated with 25 ng/ml TNF-α and 10 μg/ml cycloheximide as a positive control for cell death induction.
FIG. 7.
FIG. 7.
p53 regulates MHV68 replication. p53comp MEFs (A) or p53−/− MEFs (B) were infected with 73.Stop or 73.MR virus at an MOI of 0.001 PFU/cell. Cells were harvested at the indicated times postinfection, and viral titers were determined by plaque assay. Results are the means from triplicate samples. Error bars represent standard deviations. (C) WT or p53−/− MEFs were infected with WT, 73.Stop, or 73.MR MHV68 at an MOI of 2 PFU/cell. Equivalent numbers of cells were harvested directly by addition of Laemmli sample buffer at the indicated times postinfection. Total cell lysates were resolved by SDS-PAGE and were analyzed by immunoblotting with antibodies to the indicated proteins.
FIG. 8.
FIG. 8.
Overexpression of p53 and etoposide treatment induce viral gene expression. (A) NIH 3T3 fibroblasts were transfected with luciferase reporter promoter constructs for v-cyclin or orf50 in conjunction with either empty vector or p53 expression vector. Cells were harvested 24 h after transfection, and luciferase activity was determined. The data represent the difference (n-fold) between vector-transfected and p53-transfected cells. Results are the means from triplicate samples. Error bars represent standard deviations. (B) NIH 3T3 fibroblasts were infected with ORF50-deficient (50.Stop) MHV68 at an MOI of 10 PFU/cell. Ninety minutes postadsorption, cells were treated with DMSO or with etoposide (100 μM). Cells were harvested at 4 and 8 h posttreatment. Quantitative RT-PCR was performed for the indicated genes. Data represent the change (n-fold) in transcript levels normalized to the levels for GAPDH, as determined using the ΔΔCT method for etoposide-treated samples relative to DMSO-treated samples. Data are the averages from duplicate samples. Error bars represent the range of data. (C) NIH 3T3 fibroblasts were mock infected or were infected with WT MHV68 at an MOI of 2 PFU/cell. One hour postadsorption, cells were treated with either DMSO or etoposide (100 μM). Cells were harvested 12 h postinfection, and equivalent amounts of protein were resolved by SDS-PAGE. Samples were examined by immunoblot analysis with antibodies to the indicated proteins. The blot shown is representative of four independent experiments harvested between 8 and 12 h.
FIG. 9.
FIG. 9.
Model of predicted mLANA functions to regulate host cell stress and promote efficient viral replication. MHV68 infection elicits the activation of cellular stress pathways that may promote p53 activation. Cell stress and/or p53 activity enhances expression of viral lytic genes, and likely cellular targets, in a manner that is deleterious to both the virus and host cell. We hypothesize that mLANA functions to limit propagation of the p53-inducing stressor or directly alters the activity of p53 to regulate viral gene expression and limit host cell injury, allowing for efficient viral replication.

Similar articles

Cited by

References

    1. Adler, H., M. Messerle, M. Wagner, and U. H. Koszinowski. 2000. Cloning and mutagenesis of the murine gammaherpesvirus 68 genome as an infectious bacterial artificial chromosome. J. Virol. 74:6964-6974. - PMC - PubMed
    1. Ahn, J. W., K. L. Powell, P. Kellam, and D. G. Alber. 2002. Gammaherpesvirus lytic gene expression as characterized by DNA array. J. Virol. 76:6244-6256. - PMC - PubMed
    1. Allen, R. D., III, M. N. Dezalia, and S. H. Speck. 2007. Identification of an Rta responsive promoter involved in driving gammaHV68 v-cyclin expression during virus replication. Virology 365:250-259. - PMC - PubMed
    1. An, F. Q., N. Compitello, E. Horwitz, M. Sramkoski, E. S. Knudsen, and R. Renne. 2005. The latency-associated nuclear antigen of Kaposi's sarcoma-associated herpesvirus modulates cellular gene expression and protects lymphoid cells from p16 INK4A-induced cell cycle arrest. J. Biol. Chem. 280:3862-3874. - PubMed
    1. Baptiste, N., and C. Prives. 2004. p53 in the cytoplasm: a question of overkill? Cell 116:487-489. - PubMed

Publication types