. 2007 Oct;81(20):11195-207.
doi: 10.1128/JVI.02559-06. Epub 2007 Aug 15.

Cyclodextrins inhibit replication of scrapie prion protein in cell culture

Affiliations

Cyclodextrins inhibit replication of scrapie prion protein in cell culture

Marguerite Prior et al. J Virol. 2007 Oct.

Abstract

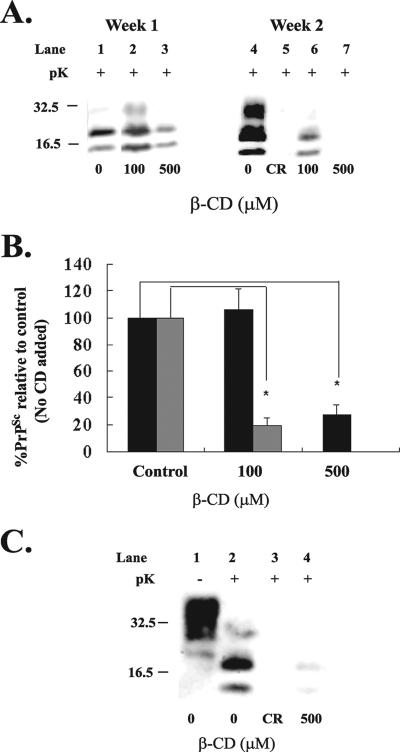
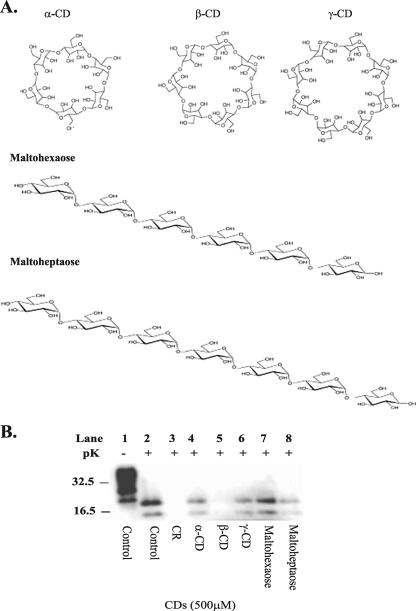
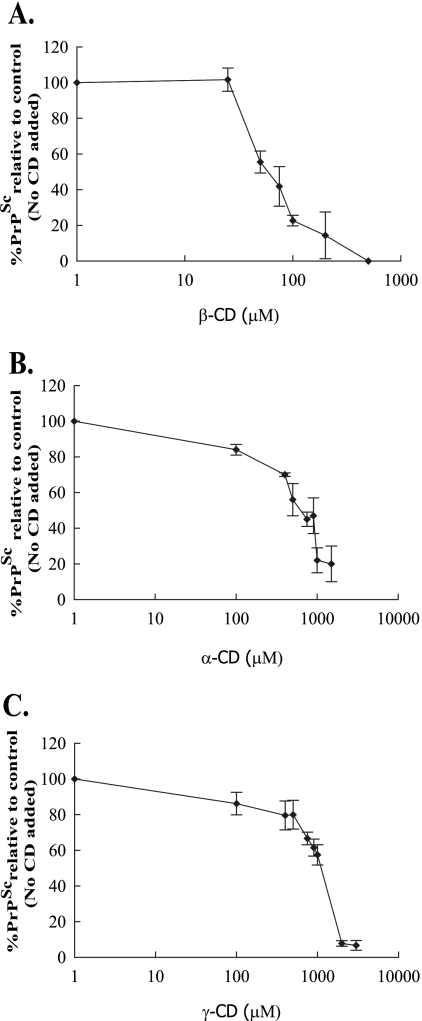
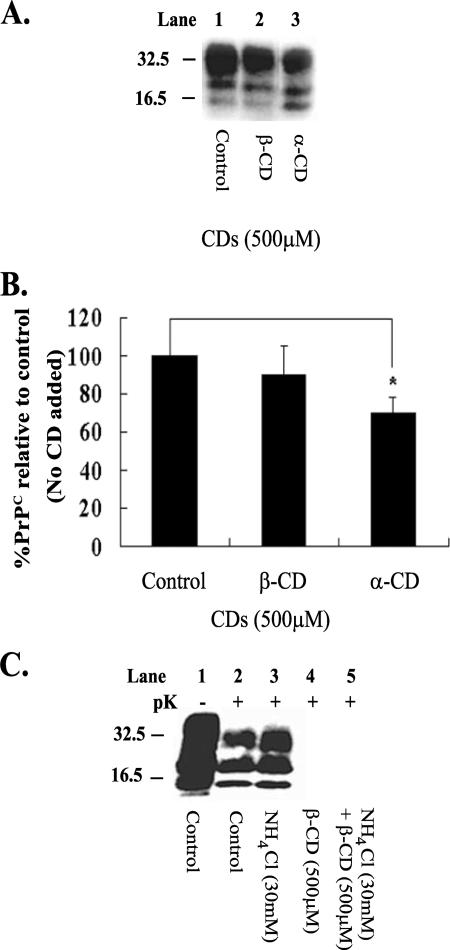
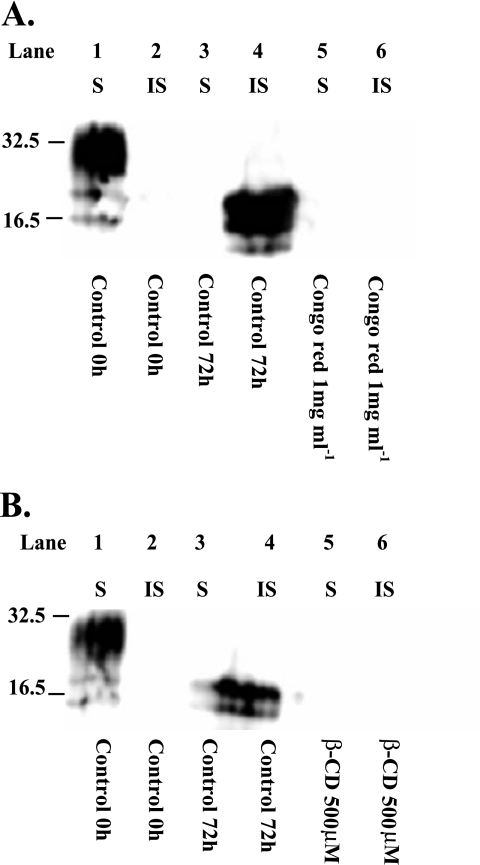
Prion diseases are fatal neurodegenerative disorders that are caused by the conversion of a normal host-encoded protein, PrP(C), to an abnormal, disease-causing form, PrP(Sc). This paper reports that cyclodextrins have the ability to reduce the pathogenic isoform of the prion protein PrP(Sc) to undetectable levels in scrapie-infected neuroblastoma cells. Beta-cyclodextrin removed PrP(Sc) from the cells at a concentration of 500 microM following 2 weeks of treatment. Structure activity studies revealed that antiprion activity was dependent on the size of the cyclodextrin. The half-maximal inhibitory concentration (IC(50)) for beta-cyclodextrin was 75 microM, whereas alpha-cyclodextrin, which possessed less antiprion activity, had an IC(50) of 750 microM. This report presents cyclodextrins as a new class of antiprion compound. For decades, the pharmaceutical industry has successfully used cyclodextrins for their complex-forming ability; this ability is due to the structural orientation of the glucopyranose units, which generate a hydrophobic cavity that can facilitate the encapsulation of hydrophobic moieties. Consequently, cyclodextrins could be ideal candidates for the treatment of prion diseases.


Figures

FIG. 1.
FIG. 1.
β-CD reduces PrPSc to undetectable levels in the 22L-infected scrapie cell line. (A) β-CD at concentrations of 100 μM and 500 μM was added to N2a22L cells at the time of passage, and the cells were then passaged in the presence of the drug for 1 and 2 weeks. (B) Representative bands shown in panel A were quantified by densitometry and expressed as a percentage of the control (untreated). Black bars represent week 1, and gray bars represent week 2. *, P < 0.005 (Student's t test). Error bars indicate standard deviations. (C) β-CD at a concentration of 500 μM was added to N2a22L20 cells at the time of passage, and the cells were passaged in the presence of the drug for 2 weeks. (A and C) Cells were lysed, and the lysate was then analyzed for PrPSc by 12% SDS-PAGE and immunoblotting with 8H4 antibody. Cell lysates were left untreated (−pK) or digested with pK (+pK) for the detection of PrPSc. Where indicated, as a drug control for PrPSc clearance, Congo red (CR) was added to the cells at 5 μg/ml for 2 weeks. Results are representative of three independent experiments. Molecular mass markers in kilodaltons are shown on the left of the panels.
FIG. 2.
FIG. 2.
Structure activity studies. (A) Structures of α-, β-, and γ-CD and their corresponding linear sugars. (B) α-, β-, and γ-CD and the linear sugars maltohexaose and maltoheptaose were added to the N2a22L cells at a concentration of 500 μM at the time of passage, and the cells were then passaged in the presence of the drugs for 2 weeks. The cells were lysed, and the lysate was then analyzed for PrPSc by 12% SDS-PAGE and immunoblotting with 8H4 antibody. Cell lysates were left untreated (−pK) or were digested with pK (+pK) for the detection of PrPSc. Where indicated as a drug control for PrPSc clearance, Congo red (CR) was added to the cells at 5 μg/ml for 2 weeks. Results are representative of three independent experiments. Molecular mass markers in kilodaltons are shown on the left of the panel.
FIG. 3.
FIG. 3.
IC50 determination for α-, β-, and γ-CD. Various concentrations of α-, β-, and γ-CD were added to the N2a22L cells at the time of passage, and the cells were then passaged in the presence of the compounds for 2 weeks. Cells were then lysed, and the lysate was then analyzed by 12% SDS-PAGE and immunoblotting with 8H4 antibody for the effect of β-CD (A), α-CD (B), and γ-CD (C) on PrPSc levels. Representative bands from immunoblots were quantified by densitometry and expressed as a percentage of the control (untreated). Results are representative of three independent experiments. Error bars indicate standard deviations.
FIG. 4.
FIG. 4.
β-CD does not act through altering PrPC levels or through an acidic compartment. (A) β- and α-CD were added to noninfected N2a cells at 500 μM each time the cells were passaged, and the cells were then lysed at 2 weeks. The lysate was prepared to 18 μg of protein, as described in Materials and Methods, before SDS-PAGE and Western blotting, and PrPC was detected with 8H4 antibody. (B) Representative bands shown in panel A were quantified by densitometry and expressed as a percentage of the control (untreated). Error bars indicate standard deviations. (C) The compounds NH4Cl (30 mM) and β-CD (500 μM) were added separately at the time of passage to N2a22L cells for 2 weeks (lanes 3 and 4, respectively). In addition, 30 mM NH4Cl was added to the N2a22L cells at the time of passage and β-CD (500 μM) was added an hour later. The cells were passaged in this manner for a period of 2 weeks (lane 5). The cells were lysed, and the lysate was then analyzed for PrPSc by 12% SDS-PAGE and immunoblotting with 8H4 antibody. Cell lysates were left untreated (−pK) or were digested with pK (+pK) for the detection of PrPSc. *, P < 0.05 (Student's t test). Results are representative of three independent experiments. Molecular mass markers in kilodaltons are shown on the left of the panels.
FIG. 5.
FIG. 5.
Effect of β-CD on PrPC, PrPSc, and GM1 association with DRMs. The N2a22L20 cell line was either treated with 500 μM β-CD at the time of passage (PrPC, PrPSc, and GM1, each with β-CD) or left untreated (PrPC, PrPSc, and GM1), and the cells were grown for 72 h. The cells were then lysed as for density gradients and adjusted to 40% sucrose, and a density gradient was applied and spun at 37,000 rpm for 18 h at 4°C. Fractions (10 × 230 μl) were collected from the top of the tube and processed for PrPC, PrPSc, and GM1 detection as described in Materials and Methods. Fraction 1 is the top of the gradient and fraction 10 is the bottom. Fractions for PrPC (A) and PrPSc (B) detection were prepared as described in Materials and Methods and analyzed by 12% SDS-PAGE and immunoblotting with 8H4 antibody. Fractions for GM1 detection (C) were blotted onto a nitrocellulose membrane and visualized using cholera toxin B conjugated to horseradish peroxidase. (D, E, and F) Representative bands from panels A (D) and B (E) and dots from panel C (F) were quantified by densitometry and were expressed as a percentage of the control (the fraction presenting with the highest signal [100%]). Results are representative of three independent experiments. Molecular mass markers in kilodaltons are shown on the left of the panels. Control results are plotted as closed diamonds, and β-CD results are plotted as closed squares.
FIG. 6.
FIG. 6.
Reintroduction of cholesterol encapsulated in Mβ-CD does not reverse PrPSc clearance, but rather facilitates it. (A) β-CD and Mβ-CD at a concentration of 500 μM were added to N2a22L20 cells at the time of passage, and the cells were then passaged in the presence of the drugs for 1 week (lanes 2 and 3, respectively). N2a22L20 cells were also treated with a combination of Mβ-CD (500 μM) and chol-Mβ-CD (46 μM), and the cells were then passaged in their presence for 1 week (lane 4). (B) Representative bands shown in panel A were quantified by densitometry and were expressed as a percentage of the control (untreated). Error bars indicate standard deviations. (C) N2a22L20 cells were treated with Mβ-CD or β-CD at a concentration of 500 μM at the time of passage, and the cells were passaged in the presence of the drugs for 1 week and then passaged in the absence of the drugs for 3 days (lanes 3 and 5) or passaged in the presence of chol-Mβ-CD (46 μM) alone for 3 days (lanes 4 and 6). (A and C) Cells were lysed, and the lysate was then analyzed for PrPSc by 12% SDS-PAGE and immunoblotting with 8H4 antibody. Cell lysates were left untreated (−pK) or digested with pK (+pK) for the detection of PrPSc. Results are representative of three independent experiments. Molecular mass markers in kilodaltons are shown on the left of the panels.
FIG. 7.
FIG. 7.
Effect of CDs on cholesterol levels and Triton X-100 insolubility of PrPC. (A) N2a22L20 cells were incubated with 0, 0.5, 1, and 10 mM β-CD or Mβ-CD for 1 h, the medium was removed, and cells were treated (+) or not treated (−) with chol-Mβ-CD (46 μM) for 1 h. Cholesterol levels were then determined. Black bars represent cells treated with CDs as indicated, and gray bars represent cells treated with CDs, followed by treatment with chol-Mβ-CD. Error bars indicate standard deviations. (B) N2a cells were grown to confluence, and the medium was then replaced with fresh medium containing 500 μM Mβ-CD for a period of 1 h or cells were left untreated (lanes 1 to 4). N2a cells were also treated with 500 μM Mβ-CD at the time of passage for a period of 72 h or cells were left untreated (lanes 5 to 8). The cells were then lysed, the lysate was prepared for the TX-100 solubility assay, and then soluble (S) and insoluble (IS) fractions were separated. Samples were then analyzed for PrPC by 12% SDS-PAGE and immunoblotting with 8H4 antibody. (C) Representative bands shown in panel B were quantified by densitometry and were expressed as percent soluble and percent insoluble. Black bars represent the percentage of soluble PrPC, and white bars represent the percentage of insoluble PrPC. Results are representative of at least three independent experiments. Molecular mass markers in kilodaltons are shown on the left of the panels.
FIG. 8.
FIG. 8.
PrPC binding to Sepharose gel containing β-CD. (A) Eight hundred micrograms of lysate from N2a cells expressing 3F4-tagged MoPrPC was loaded onto epoxy-activated Sepharose 6B gels prepared with β-CD. The gels were processed as described previously. The following were analyzed for PrPC: 2.25% (18 μg) of cell lysate (control), equivalent level (2.25%) of protein in unbound material (S1), 100% β-CD eluents (E1 and E2), and 12% of final eluent (E3). PrPC in these fractions was analyzed by 12% SDS-PAGE and immunoblotting with 3F4 antibody. (B) Representative bands shown in panel A were quantified by densitometry, and PrP levels were adjusted to the level that would be present if 100% samples were loaded. The percentage of PrP was then plotted relative to the control (the level of PrPC prior to binding to the gel). Results are representative of three independent experiments. Molecular mass markers in kilodaltons are shown on the left of the panels. Error bars indicate standard deviations.
FIG. 9.
FIG. 9.
β-CD blocks the conversion of PrPC to PrPSc. (A and B) Samples were incubated as described in Materials and Methods for 0 h (lanes 1 and 2) or 72 h at 37°C (lanes 3 and 4). Samples were also incubated in the presence of Congo red (1 mg/ml) for 72 h (panel A, lanes 5 and 6) or β-CD (500 μM) (panel B, lanes 5 and 6). After incubation, soluble (S) and insoluble (IS) PrP fractions were separated and levels were then analyzed by 12% SDS-PAGE and immunoblotting with 3F4 antibody.

Similar articles

Cited by

References

    1. Abulrob, A., J. S. Tauskela, G. Mealing, E. Brunette, K. Faid, and D. Stanimirovic. 2005. Protection by cholesterol-extracting cyclodextrins: a role for N-methyl-D-aspartate receptor redistribution. J. Neurochem. 92:1477-1486. - PubMed
    1. Adjou, K. T., R. Demaimay, J. P. Deslys, C. I. Lasmezas, V. Beringue, S. Demart, F. Lamoury, M. Seman, and D. Dormont. 1999. MS-8209, a water-soluble amphotericin B derivative, affects both scrapie agent replication and PrPres accumulation in Syrian hamster scrapie. J. Gen. Virol. 80:1079-1085. - PubMed
    1. Arispe, N., and M. Doh. 2002. Plasma membrane cholesterol controls the cytotoxicity of Alzheimer's disease AbetaP (1-40) and (1-42) peptides. FASEB J. 16:1526-1536. - PubMed
    1. Barenholz, Y. 2004. Sphingomyelin and cholesterol: from membrane biophysics and rafts to potential medical applications. Subcell. Biochem. 37:167-215. - PubMed
    1. Bate, C., M. Salmona, L. Diomede, and A. Williams. 2004. Squalestatin cures prion-infected neurons and protects against prion neurotoxicity. J. Biol. Chem. 279:14983-14990. - PubMed