. 2007 Nov;18(11):4261-78.
doi: 10.1091/mbc.e07-04-0308. Epub 2007 Aug 15.

Transcriptional modulation of genes encoding structural characteristics of differentiating enterocytes during development of a polarized epithelium in vitro

Affiliations

Transcriptional modulation of genes encoding structural characteristics of differentiating enterocytes during development of a polarized epithelium in vitro

Jennifer M Halbleib et al. Mol Biol Cell. 2007 Nov.

Abstract

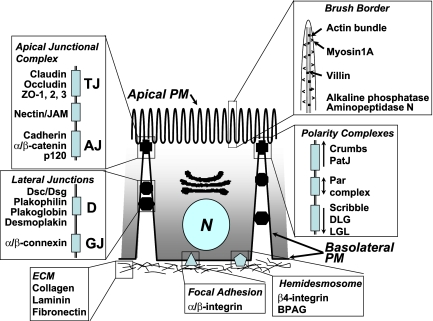
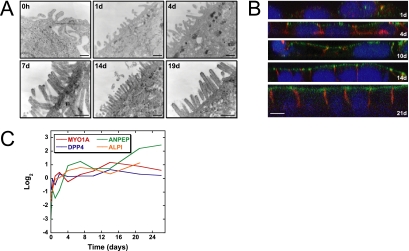
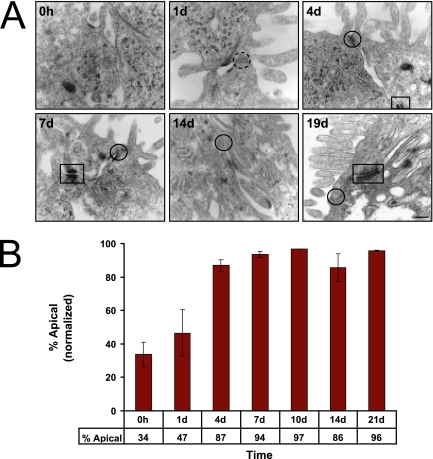
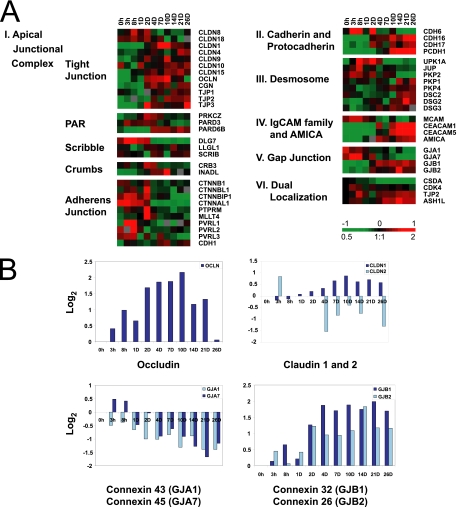
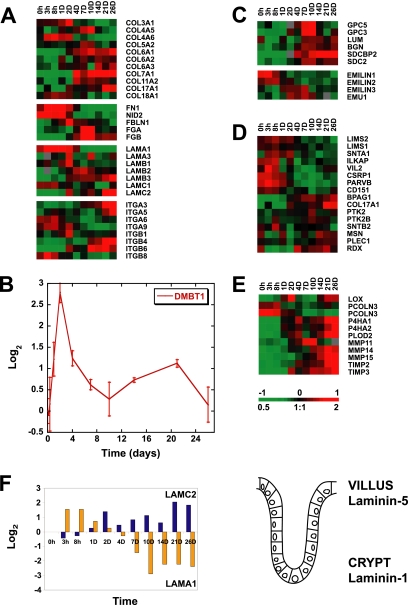
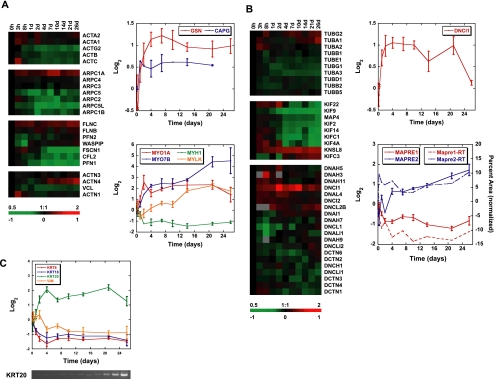
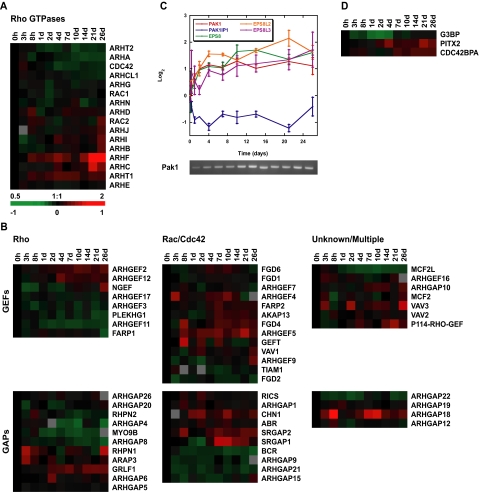
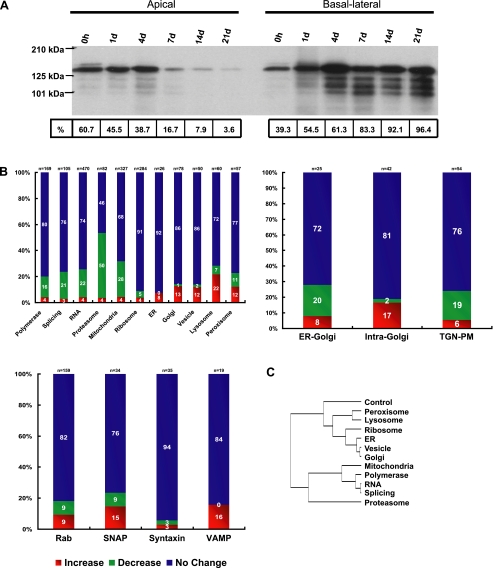
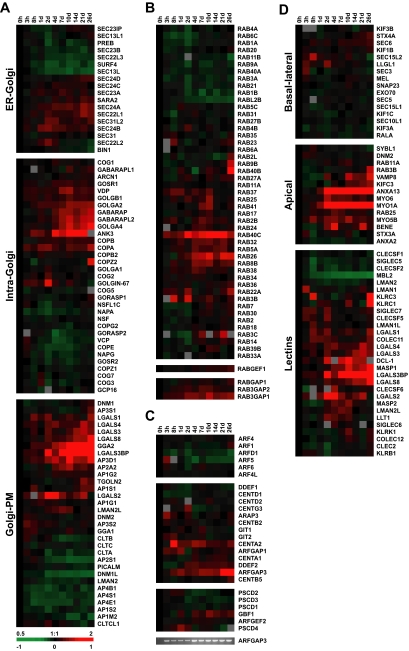
Although there is considerable evidence implicating posttranslational mechanisms in the development of epithelial cell polarity, little is known about the patterns of gene expression and transcriptional regulation during this process. We characterized the temporal program of gene expression during cell-cell adhesion-initiated polarization of human Caco-2 cells in tissue culture, which develop structural and functional polarity similar to that of enterocytes in vivo. A distinctive switch in gene expression patterns occurred upon formation of cell-cell contacts between neighboring cells. Expression of genes involved in cell proliferation was down-regulated concomitant with induction of genes necessary for functional specialization of polarized epithelial cells. Transcriptional up-regulation of these latter genes correlated with formation of important structural and functional features in enterocyte differentiation and establishment of structural and functional cell polarity; components of the apical microvilli were induced as the brush border formed during polarization; as barrier function was established, expression of tight junction transmembrane proteins peaked; transcripts encoding components of the apical, but not the basal-lateral trafficking machinery were increased during polarization. Coordinated expression of genes encoding components of functional cell structures were often observed indicating temporal control of expression and assembly of multiprotein complexes.


Figures

Figure 1.
Figure 1.
Structural characteristics of intestinal epithelial cells. Polarized epithelial cells (enterocytes) along the villus are characterized by an apical brush border; lateral adhesion complexes including adherens junctions (AJ), tight junctions (TJ), desmosomes (D), and gap junctions (GJ); polarity complexes at the apex of the lateral membrane; and contacts with the underlying matrix through hemodesmosomes and focal adhesions.
Figure 2.
Figure 2.
Formation of the apical brush border (BB), a distinctive feature of intestinal epithelial cells, is accompanied by increased expression of genes encoding brush border enzymes and structural components during in vitro Caco-2 cell differentiation. (A) Transmission electron microscopy of Caco-2 cells demonstrates the gradual formation of the apical BB during development of polarity. Scale bar, 250 nm. (B) Protein expression and subcellular localization during Caco-2 cell differentiation was examined using immunofluorescence confocal microscopy. Expression of villin, a structural component of the enterocyte brush border, and E-cadherin, a lateral cell–cell adhesion protein, are shown in green and red, respectively; DAPI (blue) stains the cell nucleus. Scale bar, 10 μm. (C) cDNA microarrays were used to analyze transcriptional profiles for genes encoding BB enzymes and structural components during the in vitro assembly of an epithelial layer. Brush border transcripts, including myosin 1A (MYO1A), dipeptidylpeptidase IV (DPP4), aminopeptidase N (ANPEP), and intestinal alkaline phosphatase (ALPI) increased significantly in expression over time during Caco-2 cell polarization. Y-axis indicates fold change of transcript levels relative to a reference pool of human mRNAs on a Log2 scale.
Figure 3.
Figure 3.
Formation of tight junctions at the boundary between the apical and basal-lateral membranes. (A) Transmission electron microscopy of Caco-2 cells during the time course revealed the formation of localized electron-dense, closely opposing plasma membranes between cells at the apex of the lateral membrane characteristic of tight junctions by day 4 (solid circle). Dashed circle indicates the location of the future tight junction before its formation. As the time course progressed, desmosomes were observed as electron-dense plaques on the lateral membrane of differentiating Caco-2 cells (box). Scale bar, 100 nm. (B) To functionally assess tight junction formation, Caco-2 monolayers were assayed for permeability of a small molecule, [3H]inulin. At early time points apically applied [3H]inulin rapidly equilibrated between the apical and basal-lateral compartments. By day 4 [3H]inulin diffusion across the monolayer was restricted. Error bars, n = 2.
Figure 4.
Figure 4.
Temporal expression patterns of genes encoding cell–cell adhesion molecules during in vitro Caco-2 epithelial cell polarization. (A) Genes are displayed and grouped according to adhesion complex or protein family: apical junction complex (cluster I), cadherin/protocadherin families (cluster II), desmosome (cluster III), immunoglobulin superfamily of adhesion molecules (cluster IV), gap junction (cluster V), and dual localization proteins (cluster VI). (B) Zero-transformed expression profiles of genes encoding the tight junction protein occludin, claudin-1 and -2, and connexin family members (α and β subunits of the gap junction). Transcript levels determined by microarray analysis are shown relative to a reference pool of human mRNAs.
Figure 5.
Figure 5.
Temporal expression patterns identified for genes encoding cell-ECM adhesion molecules during in vitro development of cell polarity, including family members of collagen, laminin and integrin receptors (A), hensin (DMBT1) (B), heparan sulfate proteoglycans (C), and hemidesmosome and focal adhesion complex components (D). Enzymes with roles in the modification or remodeling of ECM are also under fine transcriptional regulation during Caco-2 cell polarization (E). (F) Left, the reciprocal expression pattern observed for transcripts encoding components of laminin-1 and -5 (LAMA1 and LAMC2, respectively) during in vitro establishment of an epithelial layer, which mimic in vivo expression trends of laminin chains, previously identified along the human intestinal crypt villus axis (shown on the right; Leivo et al., 1996; Orian-Rousseau et al., 1996). Transcript levels determined by microarray analysis are shown relative to a reference pool of human mRNAs. A summary of the roles of individual cell–ECM components is listed in Supplementary Table S1.
Figure 6.
Figure 6.
Genomic regulation of cytoskeletal components during polarization. (A) Transcript profiles of actin and actin-associated proteins. Hierarchical clusters of actin isotype, Arp2/3 subunit, and actin-associated protein mRNA. Expression levels of each gene over time relative to the 0 h time point (zero-transformed) are displayed in log2 scale. Red or green color indicates expression levels above or below expression at 0 h over the time course, respectively. Top graph shows actin-capping protein transcript expression over time. Gene profiles are zero-transformed and displayed in log2 scale. Bottom graph displays selected myosin gene expression over the time course. (B) Gene expression of microtubule subunits and microtubule-associated proteins. Hierarchical clusters of tubulin, kinesin, and dynein/dynactin transcripts. Top graph shows cytoplasmic dynein IC 1 (DNCI1) mRNA expression over time. Bottom graph displays expression of the MAPRE gene family during cell polarization. Solid lines represent the average expression profile of each gene from microarray experiments displayed in log2 scale. Dashed lines show mRNA profiles from RT-PCR verification as percent band area normalized to total. (C) Expression of intermediate filament components during Caco-2 polarization. Graph shows the transcriptional profiles of selected keratins and vimentin over time. Bottom panel shows verification of KRT20 array profile by RT-PCR. Transcript levels determined by microarray analysis are shown relative to a reference pool of human mRNAs. Error bars, SE.
Figure 7.
Figure 7.
Expression profiles of Rho GTPases and GTPase-interacting proteins. (A) Hierarchical clustering of Rho GTPase transcripts: Rho (ARH), Rac, and Cdc42 over time. (B) Clustering of GEFs and GAPs based on specificity for Rho or Rac/Cdc42 or those of unknown or promiscuous Rho GTPase interaction. (C) Graph of PAK1, PAK1IP1, and EPS8 family mRNA expression during polarization. DNA gel below verifies PAK1 expression profile by RT-PCR. (D) Transcript profiles of MRCK (CDC42BPA), PITX2, and G3BP over the time course. Transcript levels determined by microarray analysis are shown relative to a reference pool of human mRNAs. Error bars, SE.
Figure 8.
Figure 8.
Expression of protein trafficking pathways in polarizing Caco-2 cells. (A) Immunoblots of selectively biotinylated membranes (either apical or basal-lateral) that had been immunoprecipitated with an antibody against E-cadherin and were then probed with labeled streptavidin. E-cadherin was expressed in single proliferating cells and throughout the time course and accumulated almost exclusively in the basal-lateral membrane upon Caco-2 polarization. (B) Graphs showing the number of genes that increase, decrease, or do not significantly change (using a twofold threshold) for each of the selected cell structures, functions, or protein families. Results are displayed as percentages of the total number of genes in each category to allow comparison between groups. (C) Statistical analysis of the distributions in B using pairwise chi-squared tests clustered based on similarity. Included is a control gene set of 155 randomly chosen genes. Notice that the distributions of protein trafficking pathways cluster away from those of proteasome and polymerase/splicing/RNA/mitochondria.
Figure 9.
Figure 9.
Expression profiles of individual trafficking components. (A) Hierarchical gene expression clusters of the ER-Golgi, intra-Golgi, and Golgi-PM steps of protein trafficking. (B) Rab, RabGEF, and RabGAP gene expression clusters. (C) Arf and ArfGEF and GAP mRNA profiles during polarization. DNA gel shows verification of ARFGAP3 profile by RT-PCR. (D) Clustering of transcripts encoding trafficking pathway components based on basal-lateral or apical (lectins are separated out from the other apical targeting factors for clarity) targeting functions. Transcript levels determined by microarray analysis are shown relative to a reference pool of human mRNAs.

Similar articles

Cited by

References

    1. Aijaz S., Balda M. S., Matter K. Tight junctions: molecular architecture and function. Int. Rev. Cytol. 2006;248:261–298. - PubMed
    1. Aspenstrom P. The verprolin family of proteins: regulators of cell morphogenesis and endocytosis. FEBS Lett. 2005;579:5253–5259. - PubMed
    1. Athman R., Louvard D., Robine S. The epithelial cell cytoskeleton and intracellular trafficking. III. How is villin involved in the actin cytoskeleton dynamics in intestinal cells? Am. J. Physiol. Gastrointest. Liver Physiol. 2002;283:G496–G502. - PubMed
    1. Bacallao R., Antony C., Dotti C., Karsenti E., Stelzer E. H., Simons K. The subcellular organization of Madin-Darby canine kidney cells during the formation of a polarized epithelium. J. Cell Biol. 1989;109:2817–2832. - PMC - PubMed
    1. Balda M. S., Garrett M. D., Matter K. The ZO-1-associated Y-box factor ZONAB regulates epithelial cell proliferation and cell density. J. Cell Biol. 2003;160:423–432. - PMC - PubMed

Publication types

MeSH terms