. 2007 Aug 15;27(33):8805-15.
doi: 10.1523/JNEUROSCI.2751-07.2007.

Constitutive excitation by Gly90Asp rhodopsin rescues rods from degeneration caused by elevated production of cGMP in the dark

Affiliations

Constitutive excitation by Gly90Asp rhodopsin rescues rods from degeneration caused by elevated production of cGMP in the dark

Michael L Woodruff et al. J Neurosci. .

Abstract

Previous experiments indicate that congenital human retinal degeneration caused by genetic mutations that change the Ca(2+) sensitivity of retinal guanylyl cyclase (retGC) can result from an increase in concentration of free intracellular cGMP and Ca(2+) in the photoreceptors. To rescue degeneration in transgenic mouse models having either the Y99C or E155G mutations of the retGC modulator guanylyl cyclase-activating protein 1 (GCAP-1), which produce elevated cGMP synthesis in the dark, we used the G90D rhodopsin mutation, which produces constitutive stimulation of cGMP hydrolysis. The effects of the G90D transgene were evaluated by measuring retGC activity biochemically, by recording single rod and electroretinogram (ERG) responses, by intracellular free Ca(2+) measurement, and by retinal morphological analysis. Although the G90D rhodopsin did not alter the abnormal Ca(2+) sensitivity of retGC in the double-mutant animals, the intracellular free cGMP and Ca(2+) concentrations returned close to normal levels, consistent with constitutive activation of the phosphodiesterase PDE6 cascade in darkness. G90D decreased the light sensitivity of rods but spared them from severe retinal degeneration in Y99C and E155G GCAP-1 mice. More than half of the photoreceptors remained alive, appeared morphologically normal, and produced electrical responses, at the time when their siblings lacking the G90D rhodopsin transgene lost the entire retinal outer nuclear layer and no longer responded to illumination. These experiments indicate that mutations that lead to increases in cGMP and Ca(2+) can trigger photoreceptor degeneration but that constitutive activation of the transduction cascade in these animals can greatly enhance cell survival.


Figures

Figure 1.
Figure 1.
Ca2+ sensitivity of retGC remains abnormal in mice expressing both Y99C GCAP-1 and G90D rhodopsin. a, Morphology of the retinas from wild-type and Y99C mice at 1 month of age. rpe, Retinal pigment epithelium; os, outer segments; onl, outer nuclear layer; opl, outer plexiform layer; inl, inner nuclear layer. b, Immunoblot from wild-type and Y99C retinas at the age of 1 month probed with antibodies against rhodopsin (Rhod), α and β subunits of transducin (Gαt1 and Gβ1), α and β subunits of PDE6 (PDE6α and PDE6β), GCAP-2, and retGC isozymes (retGC1 and retGC2), averaged from two measurements. c, Content of the proteins in Y99C retinas as shown in b evaluated by densitometry of immunoblot relative to the wild-type control. Inset, Relative signal intensity on immunoblot (solid line), calibrated using anti-GCAP-2 antibody as described in Materials and Methods; a would-be linear dependence is shown by the dashed line. d, Immunoblot of wild-type and Y99C GCAP-1 from L53 and a Y99C/G90D mouse retinas aged 3.5 weeks separated in 15% SDS-polyacrylamide gel and probed with anti-GCAP-1 antibody as described previously (Olshevskaya et al., 2004). e, Ratio between WT and Y99C GCAP-1 in Y99C+/−;R+/+ and Y99C/G90D mice determined by densitometry of immunoblots, average of three independent measurements. The total amount of retinal material was adjusted to produce equal intensity signals on the blots for both strains. f, Ca2+ sensitivity of retGC in dark-adapted mouse retinas extracted from WT (black circles; n = 5), L53 (black triangles; n = 2), Y99C (white diamonds; n = 2), and their Y99C/G90D littermates (white circles; n = 3) at 3.5 weeks of age. The gray bar corresponds to the free Ca2+ change between light-adapted and dark-adapted states (Woodruff et al., 2002, 2003).
Figure 2.
Figure 2.
Suction-electrode current responses of representative WT and mutant mouse rods. Responses are to 20 ms flashes of 500 nm light delivering 17, 43, 160, 450, 1100, and 4200 photons μm−2. Each trace was averaged from 5–20 flashes at lower intensities and 3–5 flashes at higher intensities. a, WT; b, Y99C; c, G90D; d, Y99C/G90D.
Figure 3.
Figure 3.
Mean normalized photocurrents from suction-electrode measurements superimposed to show differences in kinetics and response amplitude for WT (black traces; n = 35), Y99C (red traces; n = 20), G90D (green traces; n = 18), and Y99C/G90D (blue traces; n = 21). The responses of each rod were normalized to the dark circulating current for that rod, and all the normalized responses at a given intensity from the different rods were averaged to calculate the plotted responses. The flash intensities were as follows: a, 17 photons μm−2; b, 160 photons μm−2; c, 1100 photons μm−2; and d, 4200 photons μm−2. a, Inset, Expansion of first 200 ms of the WT and Y99C traces in a to show difference in rise time. d, Inset, Expansion of the first 200 ms of the traces in d to show slow component of rise for the Y99C rods, caused by larger than normal Na+/K+–Ca2+ exchange current.
Figure 4.
Figure 4.
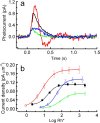
Single-photon responses and intensity–response relationships of WT and mutant rods. a, Single-photon responses for WT (black), Y99C (red), G90D (green), and Y99C/G90D (blue). Responses were calculated from suction-electrode measurements of small-amplitude responses (<20% of maximum response) from the squared mean and variance (Tsang et al., 2006) and were averaged from 14 (WT), 20 (Y99C), 16 (G90D), and 18 (Y99C/G90D) rods. b, Mean intensity–response functions for WT (black), Y99C (red), G90D (green), and Y99C/G90D (blue) averaged, respectively, from 32, 19, 10, and 21 cells. Response amplitudes and flash intensities were adjusted to compensate for different lengths of outer segments as described in Results. The data have been fitted with Boltzmann exponential functions.
Figure 5.
Figure 5.
Rescue of rods from degeneration caused by Y99C GCAP-1. a, Light microscopy of retinal sections from 5.5-month-old WT mice (top) and Y99C and Y99C/G90D (bottom) littermates at lower (10× objective, left) and higher (40× objective, right) magnification; notice the lack of the outer nuclear layer in Y99C mice and its reappearance in their Y99C/G90D siblings indicated by white arrows. rpe, Retinal pigment epithelium; os, outer segments; onl, outer nuclear layer; opl, outer plexiform layer; inl, inner nuclear layer; ipl, inner plexiform layer; gl, ganglion cell layer. The left is reconstruction from several frames of the same retina sections at 10× objective. b, Photoreceptor nuclei count (mean ± SD) per 100 μm in WT, Y99C, and Y99C/G90D littermates aged 4–6 months: 197 ± 28, n = 12; 14 ± 6, n = 10; 120 ± 17, n = 13, respectively. c, d, Electron microphotograph (at magnification of 1200×) of the distal retina in Y99C (c) versus Y+;D+;R+/− littermate (d) at 5.5 months of age. Scale bar, 10 μm. ros, Rod outer segment; cos, cone outer segment; ris, rod inner segment; cis, cone inner segment. Notice the lack of outer nuclear layer in c and the apparently normal morphology of rods in d. e, Photoreceptor disks in 5.5-month-old Y99C/G90D mouse rods (picture taken at magnification of 30,000×).
Figure 6.
Figure 6.
Restoration of dark-adapted ERG responses in Y99C GCAP-1 mice expressing G90D rhodopsin. a, Typical ERG responses in WT mice (left), Y99C (middle), and their Y99C/G90D littermates (right) after 5 months of age, flash strength increases from top to bottom. b, Maximal a-wave amplitude evoked by ∼3 × 10⁶ photons μm−2 at cornea in WT (open black squares), L53 (filled red triangles), Y99C (open red triangles), and Y99C/G90D (open blue circles) mice at different ages. Each data point represents a separate mouse. c, ERG a-wave sensitivity in WT (open black circles; mean ± SE; n = 17) and Y99C/G90D (filled blue circles; n = 16) mice at 4–6 months of age. d, ERG b-wave sensitivity in WT (open black circles; mean ± SE; n = 17) and Y99C/G90D (filled blue circles; n = 16) mice at 4–6 months of age. Notice the strong reduction in sensitivity to dim flashes.
Figure 7.
Figure 7.
Retinal degeneration in mice expressing E155G GCAP-1 and its rescue by G90D rhodopsin. a, Shift in Ca2+ sensitivity of retGC in 3.5-week-old mice expressing E155G GCAP-1 in E155G (white circles; n = 2) or E155G/G90D littermates (black squares; n = 3) compared with WT (black circles; n = 5). For additional detail, see Figure 1. b, Retinal degeneration in L541 line expressing E155G GCAP-1 in R+/+ background at 1 month and 3 months of age (left); a nonexpressing WT littermate of E155G L541 mice at 3 months of age is shown on the right (40× objective). The inset in left top panel shows distal portion of the retina in more detail. Notice the drastically distorted and dispersed outer segments at 1 month of age. rpe, Retinal pigment epithelium; is, inner segments; os, outer segments; onl, outer nuclear layer; opl, outer plexiform layer; inl, inner nuclear layer; ipl, inner plexiform layer; gl, ganglion cell layer. c, Rescue of rods in E155G/G90D (top) mouse compared with its E155G littermate (bottom) at 4 months of age (20× objective). d, Restoration in E155G/G90D mice of ERG responses lacking in their E155G littermates. e, Maximal ERG a-wave amplitude in WT (squares), E155G (triangles), and their E155G/G90D littermates (circles). Each data point represents a separate mouse.
Figure 8.
Figure 8.
Rearing L53 Y99C lines under extended period of continuous illumination. Pups produced by the L53 parental line (Olshevskaya et al., 2004) were kept under regular dark/light (2–10 lux inside the cage) 12 h cycle (9 mice), under constant ambient light generating ∼40–110 lux inside the cage (5 mice), or illuminated by an incandescent light bulb producing ∼200–700 lux inside the cage (7 mice), for 2.5 months, beginning from postnatal days 12–17. At the end of the 2.5 month period, mice were adapted overnight, used for ERG recordings, and then used for morphological analysis as described in Materials and Methods. a–c, ERG evoked by flashes of 3 × 10⁶ photons μm−2. a, The 12 h dark/light cycle control group. b, The constant 40–110 lux group. c, The constant 200–700 lux group. Averaged responses for each group are shown as thick black traces, and responses from individual mice within the group are shown as gray traces. d, Maximal averaged amplitudes from the individual eyes (mean ± SE) of the a-wave (white columns) and the b-wave (black columns) in the 12 h dark/light cycle group (left) and the constant 200–700 lux group (middle) compared with the 3-month-old Y99C G90D mice kept in 12 h dark/light cycle (right). e–g, Representative retina morphology in mice reared under the cyclic lighting (e), the 40–110 lux constant light group (f), and 200–700 lux constant light group (g). Notice the presence of several layers of photoreceptor nuclei in both the moderate and the bright constant light-reared mice (e, f) compared with the virtual lack of the photoreceptor nuclei layer in the mice reared in the cyclic light. rpe, Retinal pigment epithelium; is, inner segments; os, outer segments; onl, outer nuclear layer; opl, outer plexiform layer; inl, inner nuclear layer; ipl, inner plexiform layer; gl, ganglion cell layer.

References

    1. Baylor DA, Lamb TD, Yau KW. The membrane current of single rod outer segments. J Physiol (Lond) 1979;288:589–611. - PMC - PubMed
    1. Brooks SP, Storey KB. Bound and determined: a computer program for making buffers of defined ion concentrations. Anal Biochem. 1992;201:119–126. - PubMed
    1. Burns ME, Arshavsky VY. Beyond counting photons: trials and trends in vertebrate visual transduction. Neuron. 2005;48:387–401. - PubMed
    1. Burns ME, Mendez A, Chen J, Baylor DA. Dynamics of cyclic GMP synthesis in retinal rods. Neuron. 2002;36:81–91. - PubMed
    1. Calvert PD, Govardovskii VI, Krasnoperova N, Anderson RE, Lem J, Makino CL. Membrane protein diffusion sets the speed of rod phototransduction. Nature. 2001;411:90–94. - PubMed

Publication types

MeSH terms