. 2007 Aug 15;27(33):8903-13.
doi: 10.1523/JNEUROSCI.1571-07.2007.

NAC1 regulates the recruitment of the proteasome complex into dendritic spines

Affiliations

NAC1 regulates the recruitment of the proteasome complex into dendritic spines

Haowei Shen et al. J Neurosci. .

Abstract

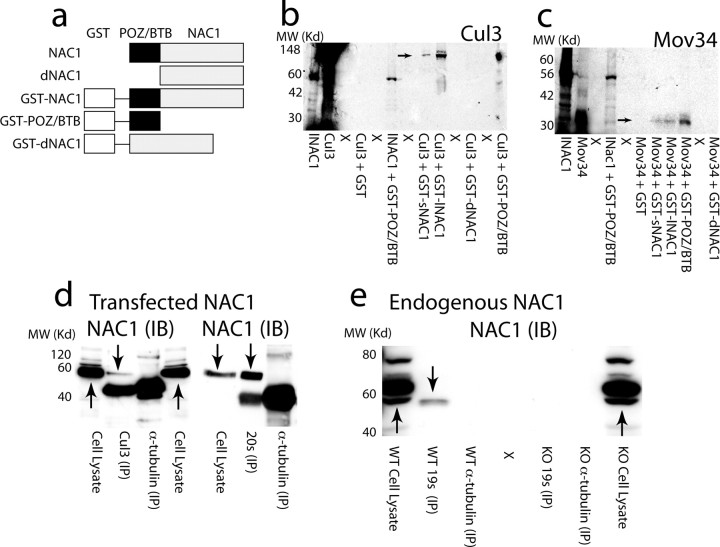
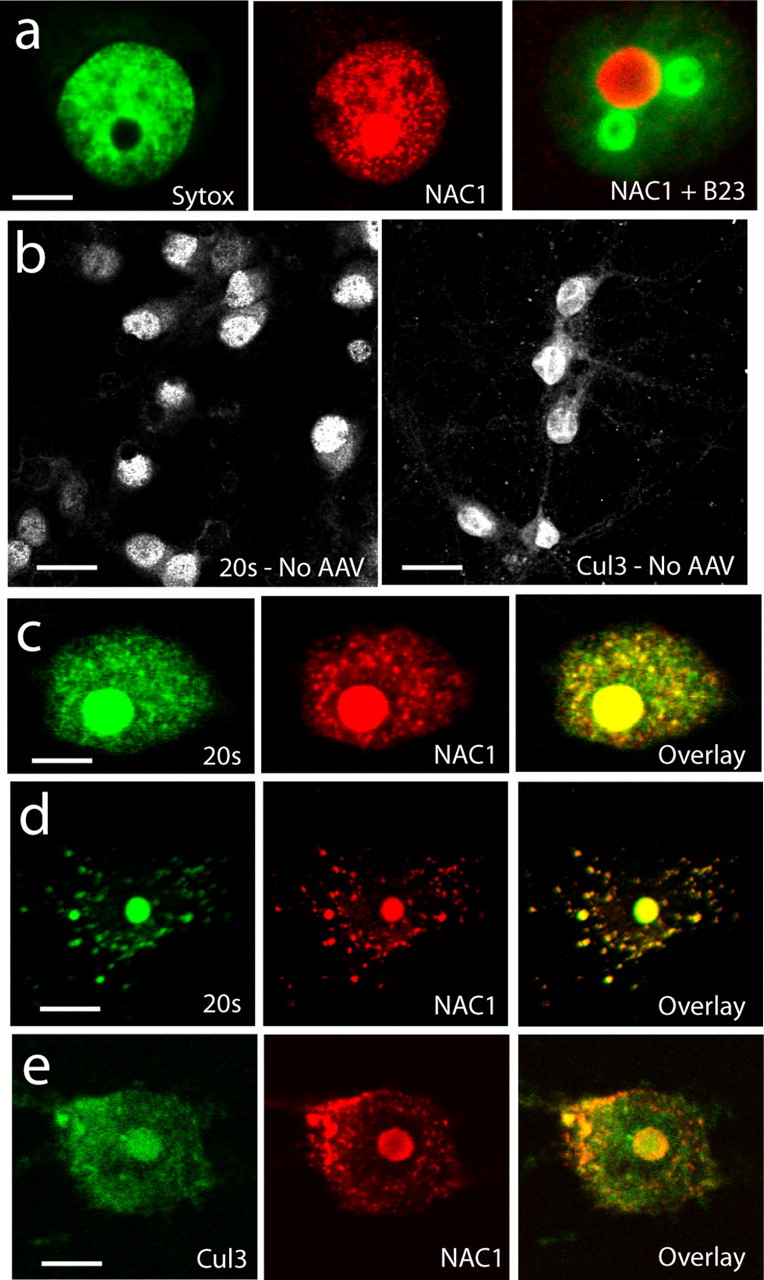
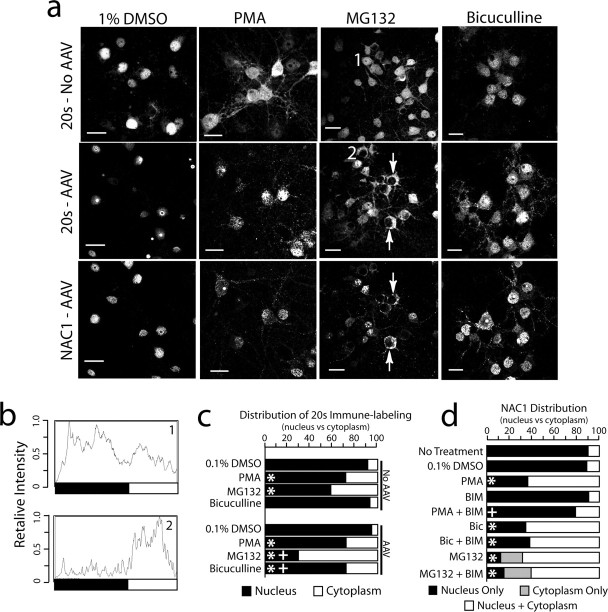
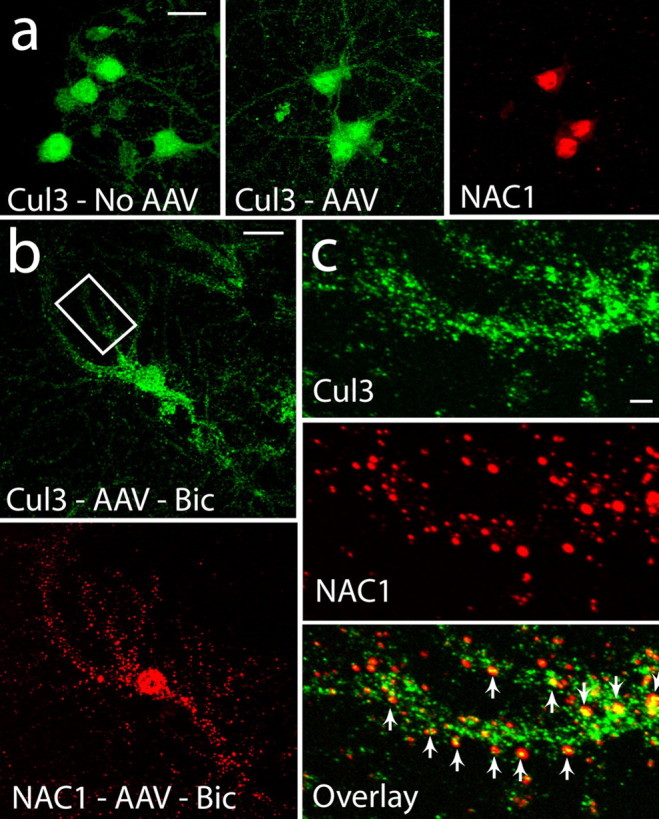
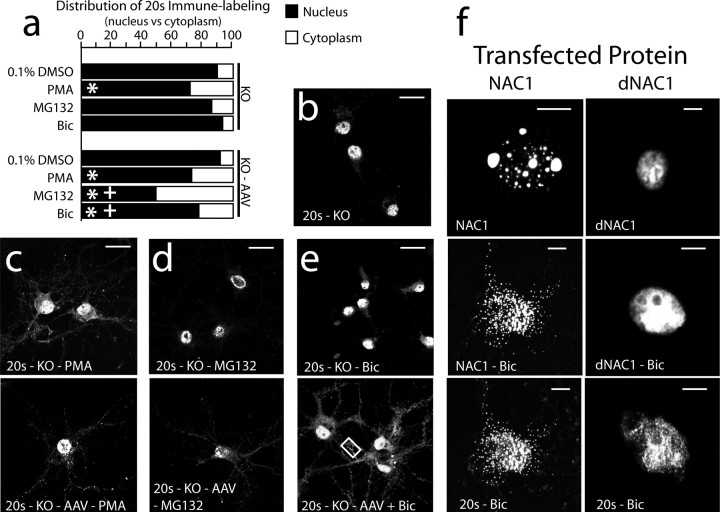
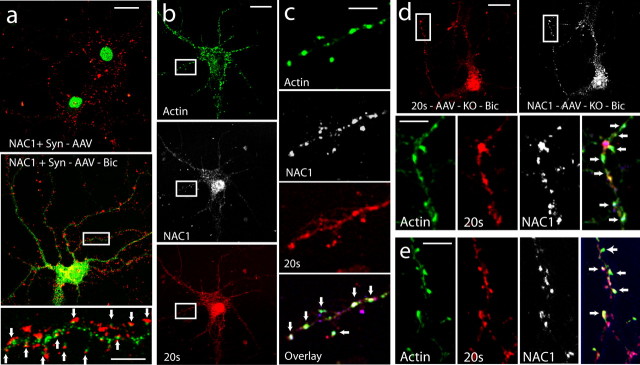
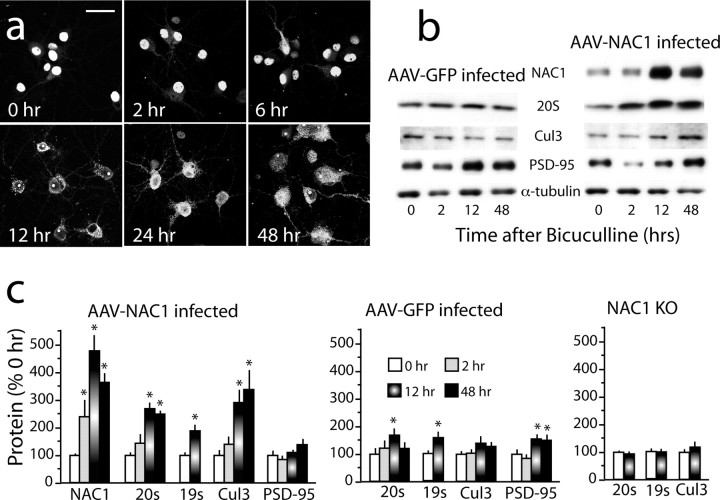
Coordinated proteolysis of synaptic proteins is required for synaptic plasticity, but a mechanism for recruiting the ubiquitin-proteasome system (UPS) into dendritic spines is not known. NAC1 is a cocaine-regulated transcriptional protein that was found to complex with proteins in the UPS, including cullins and Mov34. NAC1 and the proteasome were cotranslocated from the nucleus into dendritic spines in cortical neurons in response to proteasome inhibition or disinhibiting synaptic activity with bicuculline. Bicuculline also produced a progressive accumulation of the proteasome and NAC1 in the postsynaptic density. Recruitment of the proteasome into dendrites and postsynaptic density by bicuculline was prevented in neurons from mice harboring an NAC1 gene deletion or in neurons transfected with mutated NAC1 lacking the proteasome binding domain. These experiments show that NAC1 modulates the translocation of the UPS from the nucleus into dendritic spines, thereby suggesting a potential missing link in the recruitment of necessary proteolysis machinery for synaptic remodeling.


Figures

Figure 1.
Figure 1.
NAC1 forms a complex with cullin-based ubiquitin ligase and Mov34 in the 26S proteasome. a, Diagram of NAC1 constructs used in GST-pulldown experiment and transfection in cultured cells. b, GST-pulldown showing complex formation between Cul3 and NAC1, and dependence on the POZ/BTB binding domain. c, GST-pulldown showing POZ/BTB-dependent complex between Mov34 and NAC1. d, Immunoprecipitation with 20S proteasome subunit or Cul3 reveals interaction with HA-tagged NAC1 immunoblot (IB) in AAV-NAC1-infected primary cortical cultures. No coimmunoprecipitation of HA-tagged NAC1 was found using α-tubulin to immunoprecipitate. However, HA-tagged NAC1 could be seen in whole-cell lysates. e, Coimmunoprecipitation of endogenous NAC1 (IB) using striatal homogenates from WT and NAC1-KO mice. Immunoprecipitation by 19S antibody revealed an interaction with endogenous NAC1, whereas immunoprecipitation with anti-α-tubulin did not. X, Lane not loaded with protein. Arrows indicate presumed NAC1 immunoreactivity. IP, Immunoprecipitation.
Figure 2.
Figure 2.
Colocalization of NAC1 with Cul3 and 20S proteasome in primary cortical neurons. a, Neurons infected with AAV-NAC1 show NAC1 labeling in the nucleus (compare with nuclear labeling with Sytox green) and sometimes contained a large nucleosome that is not the nucleolus (compare with B23 labeling of nucleolus). b, Labeling for 20S and Cul3 in AAV-GFP-infected neurons shows 20S and Cul3 to be localized mainly to the nucleus and somatic cytoplasm. c, Colocalization (yellow color in overlay) of NAC1 and 20S in neuron with primarily nuclear NAC1. d, Colocalization of NAC1 and 20S in neuron showing cytoplasmic NAC1. e, Colocalization of Cul3 with NAC1. Scale bars: a, c–e, 5 μm; b, 20 μm.
Figure 3.
Figure 3.
Translocation of NAC1 and 20S from the nucleus to the cytoplasm and dendritic shaft. a, NAC1 and the 20S were translocated into the cytoplasm by MG132-induced inhibition of the proteasome (10 μm, 6 h), PMA-induced activation of PKC (10 μm, 1 h), or bicuculline disinhibition (40 μm, 2 h). DMSO was the control incubation (0.1%, 12 h). Neurons were either infected with AAV-NAC1 or not infected (No AAV). Arrows show cells with complete translocation of 20S and NAC1 from the nucleus to cytoplasm by MG132. Scale bars, 20 μm. b, Individual intensity plot of 20S cellular fluorescence corresponding to cells labeled 1 and 2 in a. c, Quantification of relative fluorescence of 20S in the nucleus versus cytoplasm after all treatments shown in a using relative intensity plots. Data were collected by an individual unaware of the treatment group and are shown as the mean proportion of fluorescence for n = 6–8 per treatment group. d, Quantification of the relative distribution of NAC1 labeling in the nucleus, nucleus and cytoplasm, and cytoplasm only (in the case of MG132, some cells had no measurable labeling in the nucleus). Quantification was made by an individual unaware of the treatment groups classify each cell in a culture dish (n = 6 dishes per treatment). For c and d, the data are presented as the mean proportion of fluorescence for n = 6–8 in each treatment group. *p < 0.05, compared with 0.1% DMSO using a Kruskal–Wallis test; +p < 0.05, comparing between treatments with or without AAV infection (c) or with or without BIM (d)
Figure 4.
Figure 4.
Translocation of Cul3 and NAC1 by bicuculline into dendrites. a, Distribution of Cul3 in uninfected cells is nuclear, cytoplasmic, and dendritic and after infection, NAC1 is highly localized to the nucleus. b, After bicuculline (40 μm, 12 h), significant amounts of NAC1 were translocated into the dendritic tree. c, NAC1 is colocalized with Cul3 in puncta in the dendritic shaft. Arrows indicate colocalized puncta. Scale bars: a, b, 20 μm; c, 5 μm.
Figure 5.
Figure 5.
Deletion of the NAC1 gene or elimination of POZ/BTB domain prevents NAC1 and 20S translocation by MG132 and bicuculline, but not by PMA. a, Relative fluorescence of 20S in nuclear versus cytoplasmic compartments in each treatment condition. Data are shown as the mean proportion of fluorescence in the nuclear versus cytoplasmic compartments. b, Predominately nuclear localization of 20S in NAC1 KO neurons. c, PMA translocates 20S in both KO and KO cells infected with AAV-NAC1. d, MG132 translocates 20S only in rescued KO cells. e, Bicuculline translocates 20S only in rescued KO cells. The box refers to high-power micrographs shown in Figure 6e. f, Neurons were transfected with either full-length NAC1 linked to GFP or truncated NAC1 linked to GFP that lacked the N-terminal POZ/BTB domain. Neither dNAC1 nor 20S were translocated by bicuculline. Scale bars: b–e, 20 μm; f, 5 μm. *p < 0.05, compared with 1% DMSO using a Kruskal–Wallis test; +p < 0.05, comparing between treatments with or without AAV infection.
Figure 6.
Figure 6.
Bicuculline translocates NAC1 and 20S into putative dendritic spines labeled for F-actin. a, Neurons double labeled for NAC1 (green) and the presynaptic marker protein synaptophysin (Syn; red). The panels compare AAV-NAC1-infected neurons with and without bicuculline (Bic) treatment (40 μm, 12 h). Arrows in the bottom indicate close apposition of NAC1 and synaptophysin staining. b, A neuron triple labeled for F-actin (green), NAC1 (white), and 20S (red). c, High-power micrograph of neuron in b showing colocalization of F-actin, NAC1, and 20S (yellow-green labeling, indicated by arrows). d, Neurons from NAC1-KO culture that were rescued by infection with AAV-NAC1 show colocalization (arrows) of F-actin, NAC1, and 20S. e, Another rescued KO cell showing colocalization (arrows; for whole-cell labeling, see box in low-resolution micrograph in Fig. 5E). Scale bars: a–e, 20 μm for low-resolution panels; 5 μm for high-resolution panels.
Figure 7.
Figure 7.
Bicuculline translocates NAC1, 20S, and Cul3 into PSD. a, Time course of bicuculline-induced translocation of NAC1 from the nucleus to the cytoplasm and dendritic shaft. b, Representative immunoblots of the time course of bicuculline-induced translocation of NAC1, 20S, and Cul3 into the PSD subfraction obtained from cultured cortical neurons infected with AAV-NAC1 or AAV-NAC1. c, Summary of immunobloting for proteins in the PSD subfraction. PSD levels of protein were measured in cultures prepared from cortical cells transfected with AAV-NAC1 or AAV-GFP, or from untransfected NAC1-KO cells. n = 6 for each group, and the data are shown as the mean ± SEM percentage change in normalized band density from time 0. Scale bar: a, low magnification, 20 μm; high magnification, 5 μm. *p < 0.05, compared with time 0 h using one-way ANOVA followed by a least significant difference test.

Similar articles

Cited by

References

    1. Allen E, Ding J, Wang W, Pramanik S, Chou J, Yau V, Yang Y. Gigaxonin-controlled degradation of MAP1B light chain is critical to neuronal survival. Nature. 2005;438:224–228. - PubMed
    1. Ambroggio XI, Rees DC, Deshaies RJ. JAMM: a metalloprotease-like zinc site in the proteasome and signalosome. PLoS Biol. 2004;2:E2. - PMC - PubMed
    1. Bingol B, Schuman EM. Synaptic protein degradation by the ubiquitin proteasome system. Curr Opin Neurobiol. 2005;15:536–541. - PubMed
    1. Bingol B, Schuman EM. Activity-dependent dynamics and sequestration of proteasomes in dendritic spines. Nature. 2006;441:144–1148. - PubMed
    1. Bonci A, Malenka R. Properties and plasticity of excitatory synapses on dopaminergic and GABAergic cells in the ventral tegmental area. J Neurosci. 1999;19:3723–3730. - PMC - PubMed

Publication types

MeSH terms