. 2007 Aug 15;27(33):8967-77.
doi: 10.1523/JNEUROSCI.2798-07.2007.

Timing and location of synaptic inputs determine modes of subthreshold integration in striatal medium spiny neurons

Affiliations

Timing and location of synaptic inputs determine modes of subthreshold integration in striatal medium spiny neurons

Adam G Carter et al. J Neurosci. .

Abstract

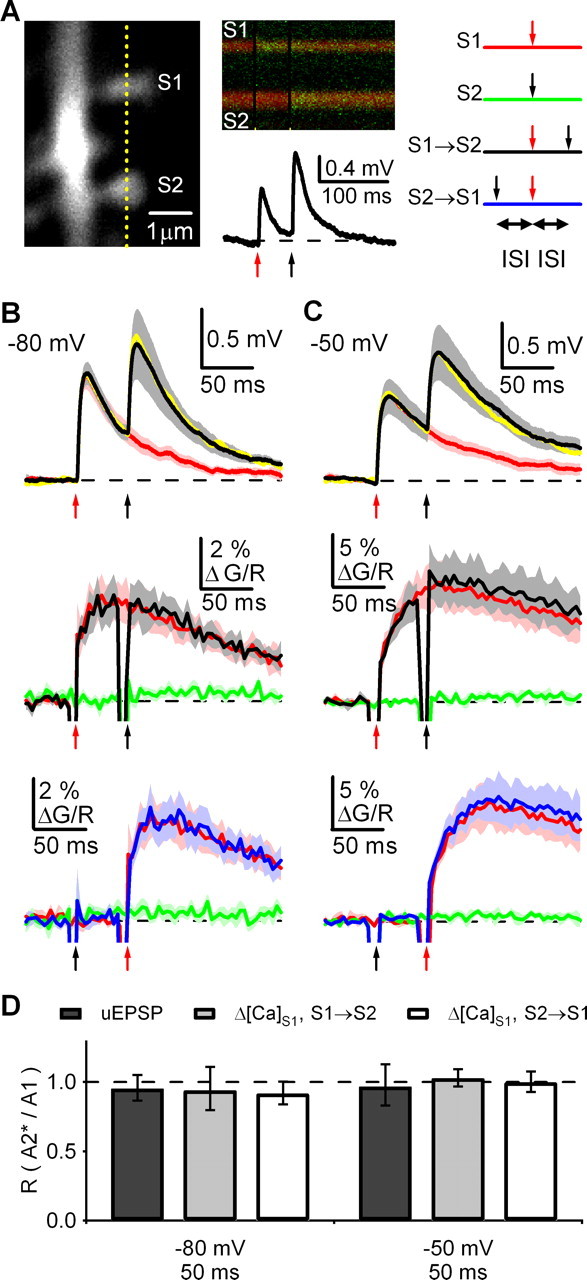
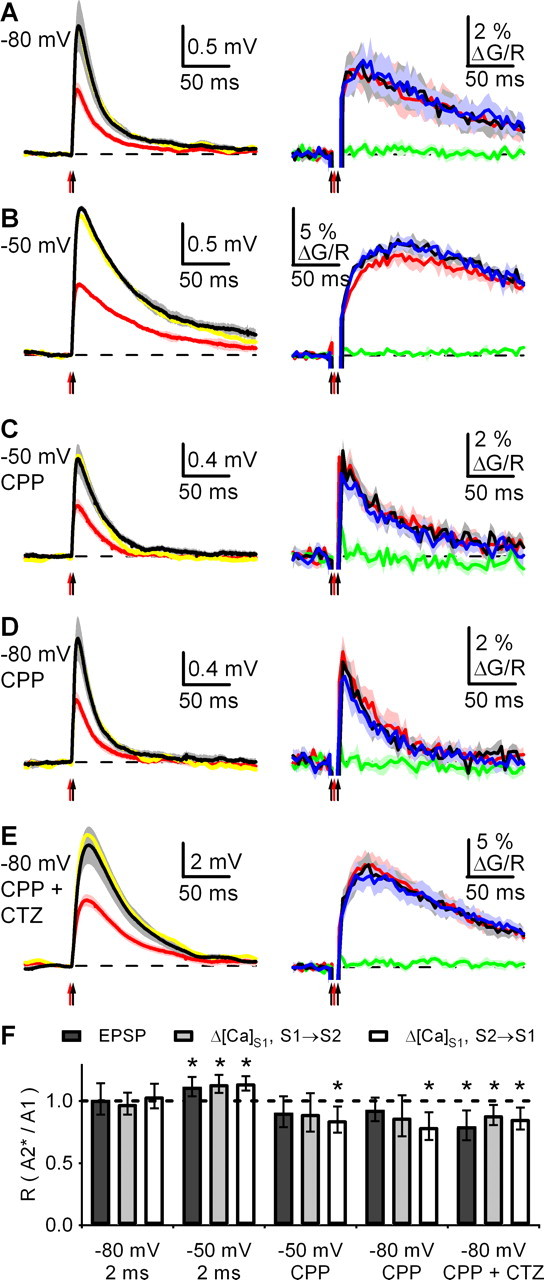
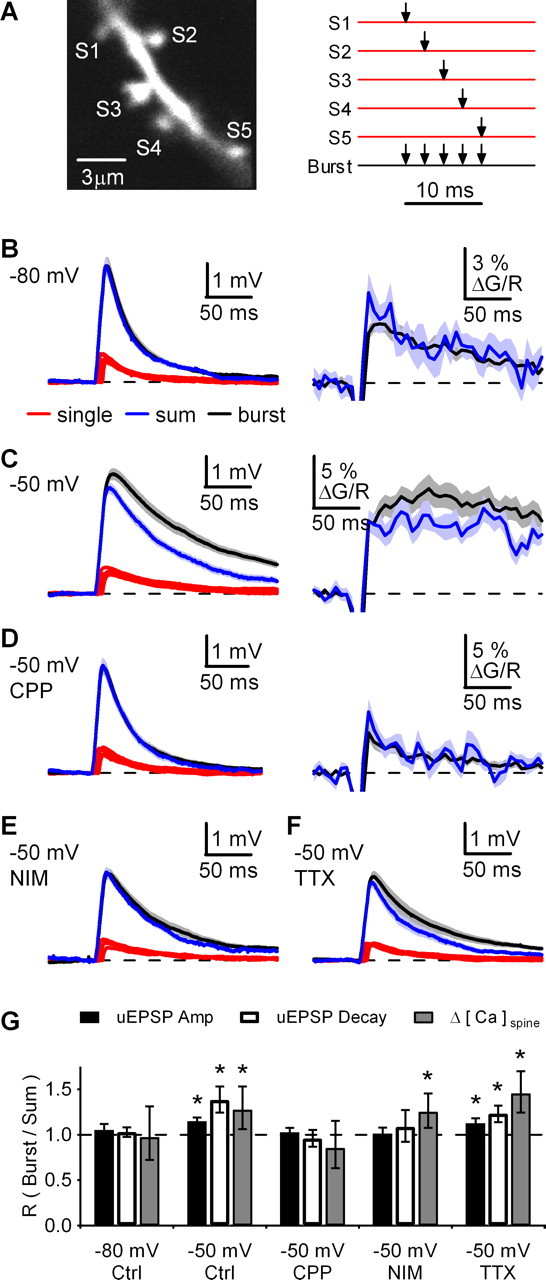
Medium spiny neurons (MSNs) are the principal cells of the striatum and perform a central role in sensorimotor processing. MSNs must integrate many excitatory inputs located across their dendrites to fire action potentials and enable striatal function. However, the dependence of synaptic responses on the temporal and spatial distribution of these inputs remains unknown. Here, we use whole-cell recordings, two-photon microscopy, and two-photon glutamate uncaging to examine subthreshold synaptic integration in MSNs from acute rat brain slices. We find that synaptic responses can summate sublinearly, linearly, or supralinearly depending on the spatiotemporal pattern of activity. Repetitive activity at single inputs leads to sublinear summation, reflecting long-lived AMPA receptor desensitization. In contrast, asynchronous activity at multiple inputs generates linear summation, with synapses on neighboring spines functioning independently. Finally, synchronous activity at multiple inputs triggers supralinear summation at depolarized potentials, reflecting activation of NMDA receptors and L-type calcium channels. Thus, the properties of subthreshold integration in MSNs are determined by the distribution of synaptic inputs and the differential activation of multiple postsynaptic conductances.


Figures

Figure 1.
Figure 1.
Excitatory inputs display postsynaptic depression. A, Left, EPSPs at −80 mV evoked by single (red trace) and paired (black traces) extracellular stimulation with ISIs of 10, 20, 50, 100, and 200 ms. Right, PPR of EPSP amplitude as a function of ISI. B, Left, 2PLSM image of a spine (S) and dendrite (D). Right, uEPSPs (top) and fluorescence transients (bottom) at −80 mV evoked by 2PLU at the spine with an ISI of 50 ms. Yellow line indicates orientation of line scan and arrows indicate uncaging times. C, uEPSPs (top) and ΔG/Rspine (middle) at −80 mV evoked by unpaired (red) and paired (black) 2PLU with an ISI of 50 ms. Solid lines are averages across multiple spines and the shaded areas represent the mean ± SEM. Bottom, PPR of uEPSP and Δ[Ca]spine amplitude at an ISI of 50 ms. D, As in C for responses recorded at a resting potential of −50 mV. *p < 0.05 compared with unity.
Figure 2.
Figure 2.
Depression is caused by AMPAR desensitization. A, AMPAR-mediated EPSCs at −80 mV in CPP (top left), CPP and γ-DGG (top right), or CPP and CTZ (bottom left) with variable ISIs. Bottom right, PPR of EPSC amplitude as a function of ISI in the indicated conditions. B, AMPAR-mediated uEPSCs (top) and ΔG/Rspine (middle) at −80 mV in CPP with an ISI of 50 ms. Bottom, PPR of uEPSC and Δ[Ca]spine amplitude at an ISI of 50 ms. C, As in B for responses obtained at −80 mV in CPP and CTZ. *p < 0.05 compared with unity.
Figure 3.
Figure 3.
Synaptically released glutamate depresses AMPAR responses. A, 2PLSM image (left) of a spine (S) and dendrite (D), fluorescence transients (top right), and ΔG/Rspine and ΔG/Rdendrite (bottom right) at −80 mV evoked by extracellular stimulation near the spine in CPP. The yellow line indicates orientation of line scan and arrow indicates stimulus time. B, Left, EPSCs at −80 mV in CPP evoked by extracellular stimulation (black trace), 2PLU (red trace), and paired activation (blue trace) with an ISI of 50 ms. Arrows indicate times of extracellular stimulation (black) and 2PLU (red). Right, EPSCs magnified from the green box, evoked by 2PLU (red trace), paired activation minus extracellular stimulation (blue trace), and the subtracted trace scaled to peak amplitude of the uEPSC (blue dotted trace).
Figure 4.
Figure 4.
NMDAR responses summate linearly. A, NMDAR-mediated EPSCs at −50 mV in NBQX (top) or NBQX and nimodipine (NIM; middle) with variable ISIs. Bottom, PPR of EPSC amplitude as a function of ISI in the indicated conditions. B, NMDAR-mediated uEPSCs (top) and ΔG/Rspine (middle) at −50 mV in NBQX with ISI = 50 ms. Bottom, PPR of uEPSC and Δ[Ca]spine amplitude at an ISI of 50 ms. *p < 0.05 compared with unity.
Figure 5.
Figure 5.
Spatially distributed excitatory inputs do not interact. A, EPSPs at −80 mV evoked by extracellular stimulation of a single pathway (red trace) or two pathways (black traces) with ISIs of 0, 2, 5, 10, 20, 50, 100, and 200 ms. B, PPR of EPSP amplitude for one pathway (closed circles; data from Fig. 1B) or two pathways (open circles) as a function of ISI. *p < 0.05 compared with unity.
Figure 6.
Figure 6.
Asynchronous synaptic inputs at neighboring spines do not interact. A, Left, 2PLSM image of dendrite and two spines (S1 and S2). Middle, Fluorescence transients (top) and simultaneous uEPSPs (bottom) at −80 mV evoked by sequential 2PLU at the two spines. Right, Stimulation schematic: S1 alone (red traces), S2 alone (green traces), S1→S2 (black traces), or S2→S1 (blue traces). Yellow line indicates orientation of line scan and arrows indicate times of 2PLU at S1 (red) and S2 (black). B, uEPSPs (top) and ΔG/RS1 (S1→S2 in middle and S2→S1 on bottom) at −80 mV with an ISI of 50 ms. For uEPSPs, red traces are single responses (S1), black traces are paired responses (S1→S2), and yellow traces are the linear predictions. For ΔG/RS1, the colored traces indicate the responses evoked by the stimulation protocols shown in the schematic in (A). C, As in B for responses recorded at −50 mV with an ISI of 50 ms. D, Ratio of the amplitudes of paired (A2*) and unpaired (A1) uEPSPs and Δ[Ca]S1 (S1→S2 and S2→S1) in the indicated conditions. Summary data are shown as the geometric mean and 95% confidence interval. *p < 0.05 compared with unity.
Figure 7.
Figure 7.
Synchronous activation of neighboring spines reveals NMDAR-dependent nonlinearities. A, uEPSPs (left) and ΔG/Rspine (both S1→S2 and S2→S1 on right) at −80 mV with an ISI of 2 ms. The colored traces are the same as those described for Figure 6. B–E, As in A for responses at −50 mV (B), at −50 mV in CPP (C), at −80 mV in CPP (D), and at −80 mV in CPP and CTZ (E). F, Ratio of the amplitudes of paired (A2*) and unpaired (A1) uEPSPs and Δ[Ca]S1 (S1→S2 and S2→S1) in the indicated conditions. Summary data are shown as the geometric mean and 95% confidence interval. *p < 0.05 compared with unity.
Figure 8.
Figure 8.
Bursts of inputs at spine clusters trigger supralinear responses. A, Left, 2PLSM image of dendrite and cluster of five spines (S1–S5). Right, Schematic showing 2PLU at each spine alone (red traces) or burst stimulation at all spines (black trace). B, Left, uEPSPs at −80 mV with an ISI of 2 ms, showing single-spine responses (red traces), the linearly predicted sum of these responses (blue trace), and burst response (black trace). Right, ΔG/Rspine measured in one of the five spines, showing the linearly predicted sum of single spine responses (blue trace) and burst response (black trace). C–F, As in B for uEPSPs and ΔG/Rspine at −50 mV (C), uEPSPs and ΔG/Rspine at −50 mV in CPP (D), uEPSPs at −50 mV in nimodipine (E), and uEPSPs at −50 mV in TTX (F). G, Ratio (R) of burst and sum for uEPSP amplitudes, uEPSP half-decay times and Δ[Ca]spine amplitudes in the indicated conditions. Summary data are shown as the geometric mean and 95% confidence interval. *p < 0.05 compared with unity.

Similar articles

Cited by

References

    1. Akopian G, Walsh JP. Corticostriatal paired-pulse potentiation produced by voltage-dependent activation of NMDA receptors and L-type Ca2+ channels. J Neurophysiol. 2002;87:157–165. - PubMed
    1. Akopian G, Walsh JP. Reliable long-lasting depression interacts with variable short-term facilitation to determine corticostriatal paired-pulse plasticity in young rats. J Physiol (Lond) 2007;580:225–240. - PMC - PubMed
    1. Alloway KD, Lou L, Nwabueze-Ogbo F, Chakrabarti S. Topography of cortical projections to the dorsolateral neostriatum in rats: multiple overlapping sensorimotor pathways. J Comp Neurol. 2006;499:33–48. - PubMed
    1. Bargas J, Ayala GX, Vilchis C, Pineda JC, Galarraga E. Ca2+-activated outward currents in neostriatal neurons. Neuroscience. 1999;88:479–488. - PubMed
    1. Cai X, Liang CW, Muralidharan S, Kao JP, Tang CM, Thompson SM. Unique roles of SK and Kv4.2 potassium channels in dendritic integration. Neuron. 2004;44:351–364. - PubMed

Publication types

MeSH terms

LinkOut - more resources