. 2007 Aug 15;21(16):2069-82.
doi: 10.1101/gad.430207.

Feedback regulation of p38 activity via ATF2 is essential for survival of embryonic liver cells

Affiliations

Feedback regulation of p38 activity via ATF2 is essential for survival of embryonic liver cells

Wolfgang Breitwieser et al. Genes Dev. .

Abstract

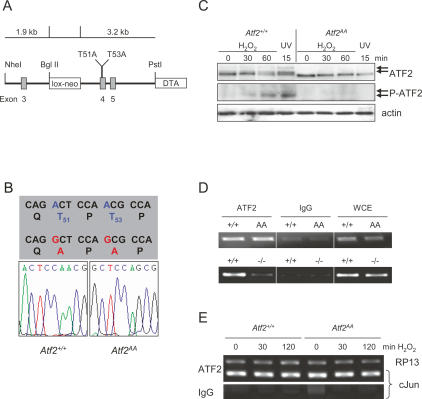
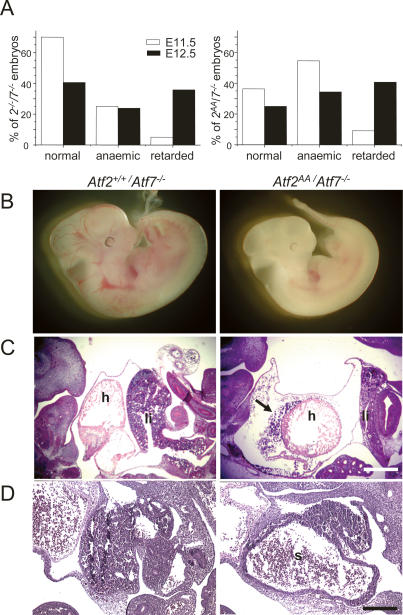
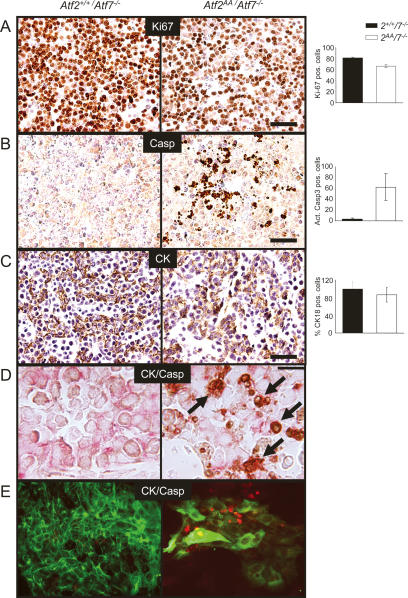
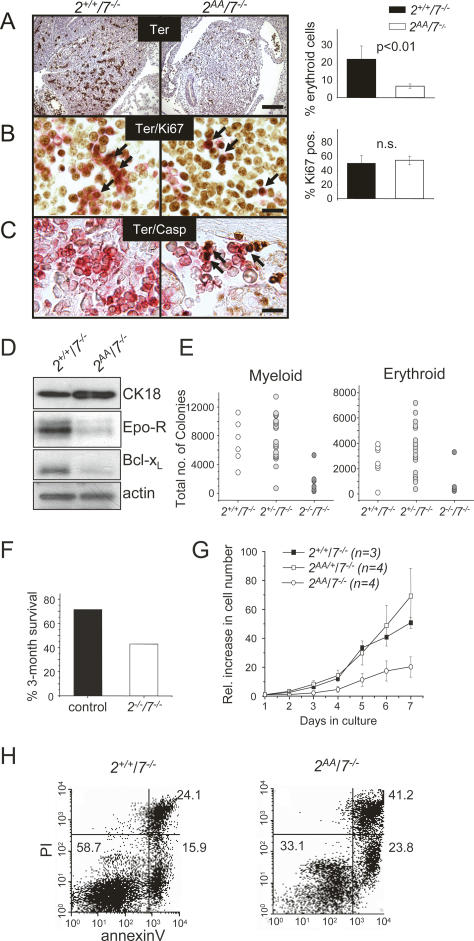
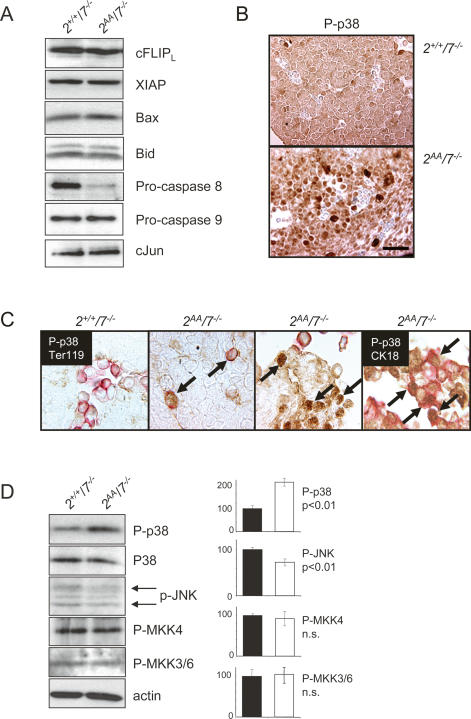
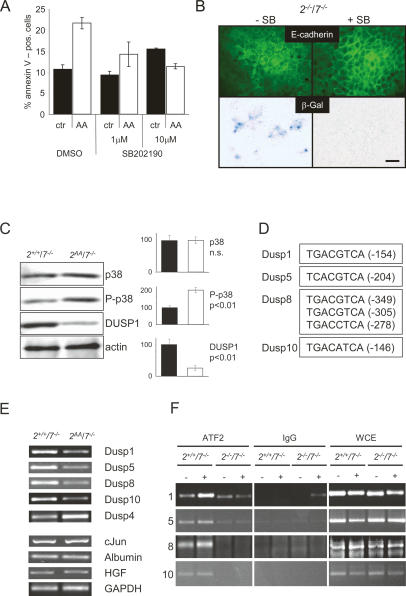
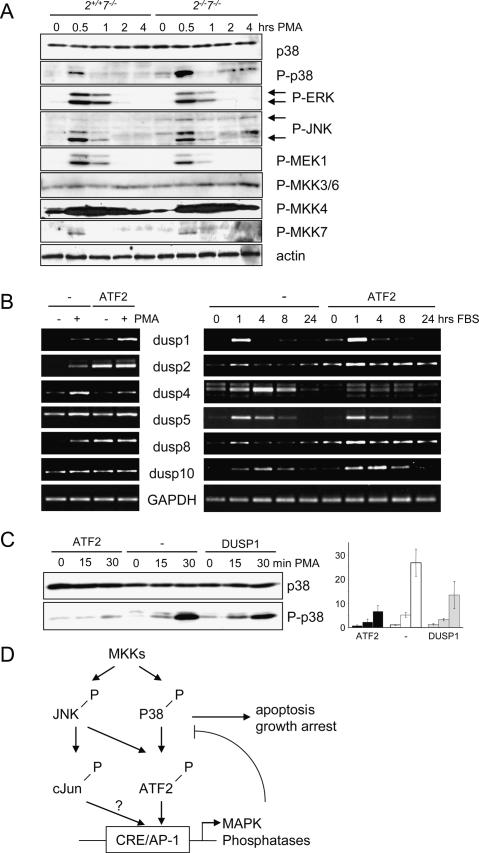
The ATF2 transcription factor is phosphorylated by the stress-activated mitogen-activated protein kinases (MAPKs) JNK and p38. We show that this phosphorylation is essential for ATF2 function in vivo, since a mouse carrying mutations in the critical phosphorylation sites has a strong phenotype identical to that seen upon deletion of the DNA-binding domain. In addition, combining this mutant with a knockout of the ATF2 homolog, ATF7, results in embryonic lethality with severe abnormalities in the developing liver and heart. The mutant fetal liver is characterized by high levels of apoptosis in developing hepatocytes and haematopoietic cells. Furthermore, we observe a significant increase in active p38 due to loss of a negative feedback loop involving the ATF2-dependent transcriptional activation of MAPK phosphatases. In embryonic liver cells, this increase drives apoptosis, since it can be suppressed by chemical inhibition of p38. Our findings demonstrate the importance of finely regulating the activities of MAPKs during development.


Figures

Figure 1.
Figure 1.
Generation of ATF2 N-terminal phosphorylation mutant mice. (A) A schematic representation of the Atf2AA knock-in strategy. Positions of exons 3–5 are shown (gray boxes). An excisable neomycin resistance gene (lox-neo) is inserted into intron 3 and a negative selection marker (Diphtheria toxin A, DTA) is inserted into intron 5 and flanks the linearized targeting vector. (B) Sequence of wild-type and Atf2AA gene in MEFs from homozygous knock-in animals encompassing the point mutations (red) leading to threonine-to-alanine substitutions at positions 51 and 53 of mouse ATF2. (C) Western blot analysis of wild-type and Atf2AA MEFs after oxidative stress (100 μM H2O2) or radiation (80 J/m2 UV). Absence of phosphorylated ATF2 bands (arrows) is apparent in Atf2AA extracts using antibodies recognizing pan-ATF2 and phospho-T53 (P-ATF2). β-actin is shown as loading control. (D) PCR analysis of cJun promoter containing the ATF-binding site jun2 from Atf2+/+ versus Atf2AA (top panel) and Atf2+/+ versus Atf2−/− (bottom panel) MEFs immunoprecipitated with ATF2 antibodies or control antibodies (IgG). Whole-cell extracts (WCE) were used as PCR controls. (E) ChIP analysis using ATF2 antibodies of cJun promoter versus unregulated RP13 promoter before and after stress induction by H2O2 (100 μM). (Bottom panel) No significant binding to the cJun promoter is detected with IgG control.
Figure 2.
Figure 2.
ATF2/7 mutant combinations lead to defects in developing heart and liver. (A) Atf2−/−/Atf7−/− and Atf2AA/Atf7−/− mutants at E11.5 and E12.5 were scored according to the severity of their defects between appearance indistinguishable to ATF2 wild-type or heterozygous embryos (normal), pale appearance without striking difference in developmental stage (anemic), or severe developmental abnormalities and arrest (retarded). (B) Comparison between normal Atf2+/+/Atf7−/− embryo (left) and developmentally retarded Atf2AA/Atf7−/− mutant (right) at E12.5. Bar, 50 μm. (C) Haematoxilin and eosin (H&E) staining of E12.5 corresponding sections from Atf2+/+/Atf7−/− embryos (left) and Atf2AA/Atf7−/− embryos (right). Heads are situated to the left. Defects in double mutant embryos include hypoplasia of the liver (li) and heart (h), often accompanied by large pericardial spaces and cardiac hemorrhages (arrow). Bar, 25 μm. (D) H&E staining of E12.5 embryos. In contrast to Atf2+/+/Atf7−/− embryos (left), livers in Atf2AA/Atf7−/− embryos (right) are often dysplastic with large sinuses (s) apparent. Bar, 10 μm.
Figure 3.
Figure 3.
Apoptotic defects in ATF2/7 mutant fetal liver cells. Atf2+/+/Atf7−/− samples are shown at the left, and Atf2AA/Atf7−/− samples are shown at the right. Signal quantitation and statistical analysis were done on comparative fields of at least three sectioned livers. (A–C) Immunostainings were visualized by alkaline phosphatase (AP) staining (brown) and Gill 1× haematoxilin counterstaining of nuclei (blue). Bars, 2.5 μm. (A) Ki67 staining shows that while overall cell density is reduced, proliferation is ongoing in double mutant embryos. The graph indicates a small reduction in proliferating cells in double mutants (P < 0.01). (B) Activated caspase 3 (Casp) staining reveals excessive apoptotic activity in mutant liver sections. The graph indicates the average occurrence of apoptotic signals per liver section (P < 0.01). (C) Cytokeratin 18 (CK) staining (brown) reveals the presence of hepatoblasts in mutant sections. Many positive signals appear to be in small, rounded up cells. The graph shows the relative number of mutant CK18-positive cells as percentage of controls (n.s.). (D) Double antibody staining for CK18 (HRP, red) and activated caspase 3 (AP, brown) reveals apoptosis in hepatoblasts (arrows). (E) Immunofluorescence of fetal hepatocytes (CK18, green) in culture. Mutant cells are far reduced in number compared with control hepatocytes, mostly displaying large cytoplasms and associated with high apoptotic activity (activated caspase 3, red).
Figure 4.
Figure 4.
Haematopoietic defects in ATF2/7 mutant fetal livers. Sections of Atf2+/+/Atf7−/− (left) and Atf2AA/Atf7−/− (right) embryos (E11.5) are shown. Bars: A, 10 μm; B,C, 2.5 μm. (A) Staining of Ter119 (AP, brown) reveals great loss of erythroid cells in double mutant livers. The graph shows the percentage of erythroid (Ter119-positive) cells of the total cells in liver sections. (B) Staining of embryonic sections for Ter119 (HRP, red) and Ki67 (AP, brown). Arrows indicate double-stained cells present in controls and mutants. The graph shows the percentage of Ter119-positive cells expressing Ki67. (C) Double staining for Ter119 (HRP, red) and activated caspase 3 (AP, brown) reveals apoptosis in erythroid cells (arrows). (D) Western blot analysis of Atf2+/+/Atf7−/− and Atf2AA/Atf7−/− embryonic liver extracts at E12.5. Antibodies used were against cytokeratin 18 (CK18), erythropoietin receptor (Epo-R), Bcl-xL, cJun, and β-actin. (E) Haematopoietic colony-forming cells from E12.5 livers. The total numbers of precursors per fetal liver were calculated by multiplying the average frequency of precursors in three dishes by the number of cells per fetal liver. Average numbers of myeloid colonies per liver were 6988 (standard deviation [SD], 1515) in Atf2+/+/Atf7−/−, 7812 (SD, 1333) in Atf2+/−/Atf7−/−, and 1857 (SD, 479) in Atf2AA/Atf7−/− (P < 0.005). Average numbers of erythroid colonies per liver were 3542 (SD, 691) in Atf2+/+/Atf7−/−, 4053 (SD, 965) in Atf2+/−/Atf7−/−, and 1108 (SD, 309) in Atf2AA/Atf7−/− (P < 0.002). Statistical analysis was performed using one-way ANOVA. (F) Survival rates of irradiated animals after injection of ATF2/7 mutant fetal liver cells. Control (Atf2+/+/Atf7−/− and Atf2+/−/Atf7−/−, n = 7) or Atf2−/−/Atf7−/− (n = 7) E12.5 fetal liver cells were administered to lethally irradiated PEP3 animals. The 3-mo survival rates of recipient animals are shown as the percentage of the input number. (G) Doubling indices of haematopoietic cells from control and double mutant embryonic livers in culture. Cells were seeded at 1 × 10⁶ per milliliter and diluted to the same density every 48 h over 7 d. Graphs were plotted as averages of each represented genotype. (H) Apoptosis analysis of haematopoietic cells. Fetal liver cells were cultured in haematopoietic medium and stained for annexin V-FITC/PI and analyzed by FACS. The percentage rates of late apoptotic/dead cells (top right quadrant), live cells (bottom left quadrant), and early apoptotic cells (bottom right quadrant) are shown as the average of three clones of each analyzed phenotype.
Figure 5.
Figure 5.
Apoptotic regulators in ATF2/7 mutant livers. (A) Western blot analysis of Atf2+/+/Atf7−/− and Atf2AA/Atf7−/− embryonic liver extracts. Proteins were probed with antibodies against cFLIP, XIAP, Bax, Bid, Pro-caspase 8, Pro-caspase 9, and cJun. (B) AP staining of P-p38 in Atf2+/+/Atf7−/− (top) and Atf2−/−/Atf7−/− (bottom) paraffin-embedded embryonic liver section (E12.5). Nuclei are stained with haematoxilin (blue). Bar, 2.5 μm. (C) Double staining of embryonic sections for peroxidase-labeled P-p38 (brown) and AP-labeled (red) Ter119 (first through third panels from left) or CK18 (fourth panel). Arrows indicate strong P-p38 signals in erythroid cells (third panel) or hepatocytes (fourth panel) in double mutants. (D) Western blot analysis of Atf2+/+/Atf7−/− and Atf2AA/Atf7−/− embryonic liver extracts (E12.5). Densitometric measurements were taken from Western blot analyses of three independent embryo litters and averages were plotted. Staining against pan-p38 and P-p38 reveal increased levels of the activated form of the kinase, while overall protein levels are constant. A small but significant decrease in phosphorylated JNK levels (p54 and p46, arrows) was apparent. No significant changes were apparent in phosphorylation status of MKK4 and MKK3/6.
Figure 6.
Figure 6.
Regulation of p38 activity controls fetal liver apoptosis. (A) FACS analysis of Atf2+/+/Atf7−/− and Atf2AA/Atf7−/− haematopoietic cultures derived from fetal livers. Cultures were mock-treated or continuously treated with p38 inhibitor SB202190 (1 or 10 μM) over 4 d, stained with annexin V-FITC and PI, and analyzed by flow cytometry. The graph shows the average distribution of live (PI-negative), nonapoptotic (annexin V-low) versus apoptotic (annexin V-high) cells from three independent cell lines of control cells (black bar) and double mutant cells (white bar). (B) p38-dependent premature cellular senescence of ATF2/7 mutant hepatocytes in culture. Primary Atf2−/−/Atf7−/− fetal hepatocytes were cultured for 5 d in the absence (−) or presence (+) of SB202190 (2 μM) and stained for senescence-associated β-galactosidase. Mock-treated cells frequently stain blue, while p38-inhibitor-treated cells rarely stain blue. Top panels show fluorescent staining for E-cadherin (green) to identify hepatocytes. Bar, 2.5 μm. (C) Western blot analysis of Atf2+/+/Atf7−/− and Atf2AA/Atf7−/− fetal livers reveals loss of DUSP1 protein, correlating with increased levels of P-p38 in ATF2/7 mutant extracts. Densitometric quantification and statistical significance is shown on the right. β-actin is shown as loading control. (D) Schematic view of mouse dual-specificity phosphatase gene promoters. Putative ATF/AP-1-binding sites and their positions with respect to transcription start sites are shown. (E) RT–PCR analysis of RNA extracts from Atf2+/+/Atf7−/− and Atf2AA/Atf7−/− embryonic livers. PCR primer pairs were designed to span intronic sequences where possible. (F) ChIP of promoter sequences of dual-specificity phosphatase genes Dusp1 (1), Dusp5 (5), Dusp8 (8), and Dusp10 (10) before and after anisomycin treatment (aniso, 10 μg/mL). ATF2 and control IgG antibodies were used. Whole-cell extracts (WCE) were used as PCR controls.
Figure 7.
Figure 7.
ATF2 restricts p38 phosphorylation in MEFs. (A) Primary Atf2+/+/Atf7−/− and Atf2−/−/Atf7−/− MEFs before and after stress (PMA, 1 μg/mL). Phosphorylation levels of p38 (T180/Y182), ERK (T202/Y204), JNK (T183/Y185), MKK3/6 (S189/207), MKK4 (S257/T261), and MKK7 (S271/T275) were determined using phospho-specific antibodies. β-actin is shown as loading control. (B) RT–PCR analysis of RNA extracts of immortalized Atf2−/−/Atf7−/− MEFs transformed with control retrovirus pBP (−) or pBP expressing wild-type ATF2. Expression of DUSP genes was analyzed upon stress induction (PMA 1 μg/mL, 20 min) or FBS (10%). (C) Phosphorylation levels of p38 after stress induction (PMA, 1 μg/mL) in Atf2−/−/Atf7−/− MEFs transformed with retrovirus pBP as control (−), or pBP expressing ATF2 or DUSP1. Total p38 levels are shown as loading control. The graph shows the levels of P-p38 relative to total p38 as the averages of three independent experiments. (D) Model of feedback mechanism involving activated ATF2 regulating p38 activity. MKKs activate JNK and p38 by phosphorylation. Among MAPK targets are cJun and ATF2 (and ATF7), which regulate the expression of MAPK phosphatases. Failure in their activation leads to hyperactive p38, which, at least in the developing liver, is detrimental to cell survival and growth.

Similar articles

Cited by

References

    1. Adams R.H., Porras A., Alonso G., Jones M., Vintersten K., Panelli S., Valladares A., Perez L., Klein R., Nebreda A.R., Porras A., Alonso G., Jones M., Vintersten K., Panelli S., Valladares A., Perez L., Klein R., Nebreda A.R., Alonso G., Jones M., Vintersten K., Panelli S., Valladares A., Perez L., Klein R., Nebreda A.R., Jones M., Vintersten K., Panelli S., Valladares A., Perez L., Klein R., Nebreda A.R., Vintersten K., Panelli S., Valladares A., Perez L., Klein R., Nebreda A.R., Panelli S., Valladares A., Perez L., Klein R., Nebreda A.R., Valladares A., Perez L., Klein R., Nebreda A.R., Perez L., Klein R., Nebreda A.R., Klein R., Nebreda A.R., Nebreda A.R. Essential role of p38α MAP kinase in placental but not embryonic cardiovascular development. Mol. Cell. 2000;6:109–116. - PubMed
    1. Beg A.A., Sha W.C., Bronson R.T., Ghosh S., Baltimore D., Sha W.C., Bronson R.T., Ghosh S., Baltimore D., Bronson R.T., Ghosh S., Baltimore D., Ghosh S., Baltimore D., Baltimore D. Embryonic lethality and liver degeneration in mice lacking the RelA component of NF-κ B. Nature. 1995;376:167–170. - PubMed
    1. Behrens A., Sibilia M., Wagner E.F., Sibilia M., Wagner E.F., Wagner E.F. Amino-terminal phosphorylation of c-Jun regulates stress-induced apoptosis and cellular proliferation. Nat. Genet. 1999;21:326–329. - PubMed
    1. Behrens A., Sabapathy K., Graef I., Cleary M., Crabtree G.R., Wagner E.F., Sabapathy K., Graef I., Cleary M., Crabtree G.R., Wagner E.F., Graef I., Cleary M., Crabtree G.R., Wagner E.F., Cleary M., Crabtree G.R., Wagner E.F., Crabtree G.R., Wagner E.F., Wagner E.F. Jun N-terminal kinase 2 modulates thymocyte apoptosis and T cell activation through c-Jun and nuclear factor of activated T cell (NF-AT) Proc. Natl. Acad. Sci. 2001;98:1769–1774. - PMC - PubMed
    1. Benbrook D.M., Jones N.C., Jones N.C. Heterodimer formation between CREB and JUN proteins. Oncogene. 1990;5:295–302. - PubMed

Publication types

MeSH terms

Substances