. 2007:3:133.
doi: 10.1038/msb4100173. Epub 2007 Aug 14.

Environmental signal integration by a modular AND gate

Affiliations

Environmental signal integration by a modular AND gate

J Christopher Anderson et al. Mol Syst Biol. 2007.

Abstract

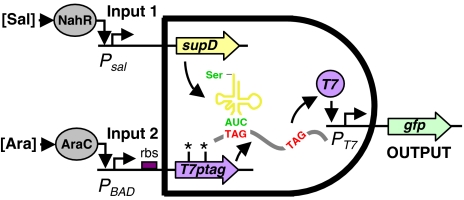
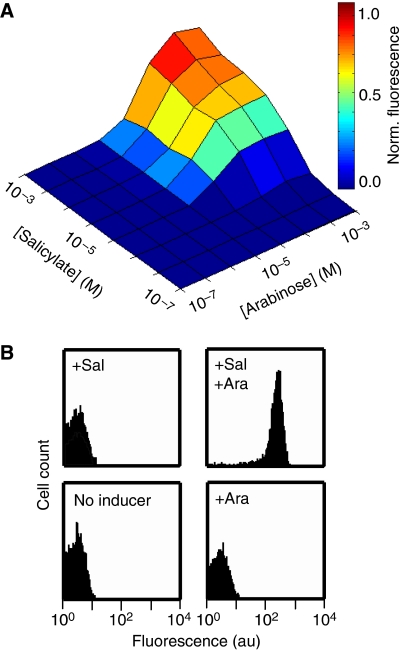
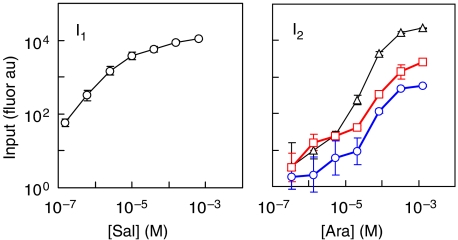
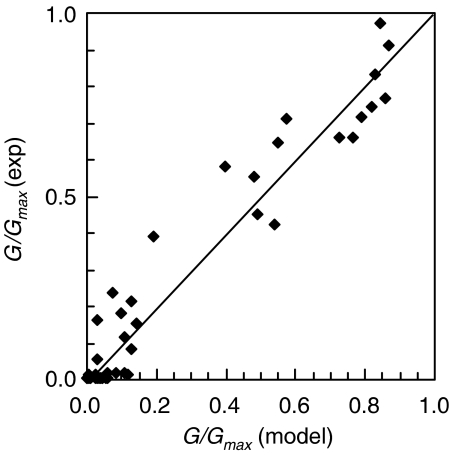
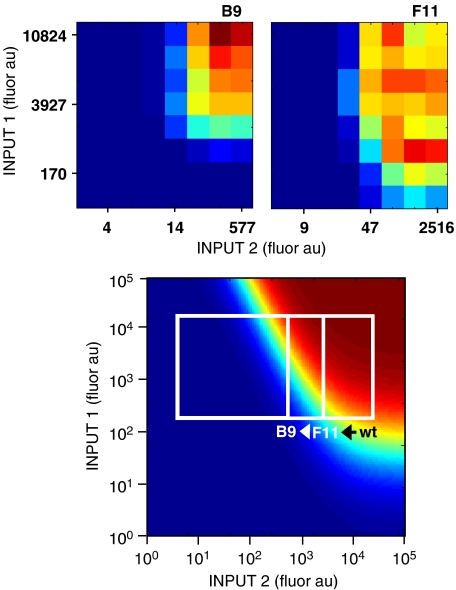
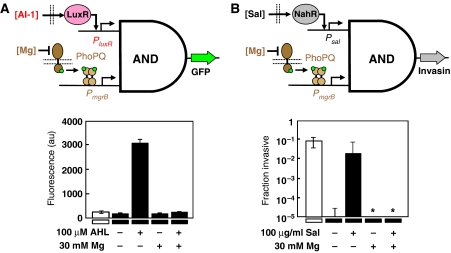
Microorganisms use genetic circuits to integrate environmental information. We have constructed a synthetic AND gate in the bacterium Escherichia coli that integrates information from two promoters as inputs and activates a promoter output only when both input promoters are transcriptionally active. The integration occurs via an interaction between an mRNA and tRNA. The first promoter controls the transcription of a T7 RNA polymerase gene with two internal amber stop codons blocking translation. The second promoter controls the amber suppressor tRNA supD. When both components are transcribed, T7 RNA polymerase is synthesized and this in turn activates a T7 promoter. Because inputs and outputs are promoters, the design is modular; that is, it can be reconnected to integrate different input signals and the output can be used to drive different cellular responses. We demonstrate this modularity by wiring the gate to integrate natural promoters (responding to Mg(2+) and AI-1) and using it to implement a phenotypic output (invasion of mammalian cells). A mathematical model of the transfer function is derived and parameterized using experimental data.


Figures

Figure 1
Figure 1
A schematic representation of the genetic AND gate is shown. Two promoters are the inputs into the gate. The first promoter is linked to the transcription of the amber suppressor tRNA supD. The second promoter drives the transcription of T7 RNA polymerase. The polymerase gene has been modified to contain two amber stop codons (T7ptag). These stop codons are translated as serine when supD is also transcribed. Polymerase is expressed only when both SupD and T7ptag mRNA are present. To characterize the transfer function of the AND gate, two input promoters are used that respond to the small molecules salicylate and arabinose. In addition, the output is connected to the expression of fast-degrading green fluorescent protein.
Figure 2
Figure 2
Integration of two inducible promoters by the AND gate. (A) The fluorescence was measured for 64 combinations of inducer in a fluorimeter. The data are shown for (left to right) 0, 3.2 × 10⁻⁷, 1.3 × 10⁻⁶, 5.2 × 10⁻⁶, 2.1 × 10⁻⁵, 8.3 × 10⁻⁵, 3.3 × 10⁻⁴, and 1.3 × 10⁻³ M arabinose, and (bottom to top) 0, 1.5 × 10⁻⁷, 6.1 × 10⁻⁷, 2.4 × 10⁻⁶, 9.8 × 10⁻⁶, 3.9 × 10⁻⁵, 1.6 × 10⁻⁴, and 6.2 × 10⁻⁴ M salicylate. (B) The fluorescence was measured in individual cells using a flow cytometer to determine the population level behavior. The entire population of cells is turned on in the presence of both arabinose and salicylate (1.3 × 10⁻³ and 6.2 × 10⁻⁴ M, respectively). When either inducer is not added, the entire population is turned off. There is a 1000-fold induction between the ON and OFF states. The data for this figure were obtained using plasmids pAC-SalSer914, pBACr-AraT7940, and pBR939b (Supplementary information).
Figure 3
Figure 3
The individual transfer functions for the input promoters are shown. The transfer functions were measured by fusing the promoter to gfp and measuring the fluorescence as a function of the concentration of small molecule inducer (salicylate or arabinose). The transfer functions were used to parameterize the AND gate model. The left panel shows the activation of Psal in response to salicylate. This promoter is leaky even in the complete absence of inducer. The right panel shows the transfer functions for the PBAD parent rbs (△), F11 (red ▪), and B9 (blue ○) clones (Table I). The average and standard deviation of four fluorimetry experiments are shown (the error is often smaller than the size of the data point). The data shown in this figure were obtained using plasmids pBACr899 (Psal), pBAC872s (PBAD, parent rbs), pBAC978 (PBAD, F11 rbs), pBAC987 (PBAD, B9 rbs) (Supplementary information).
Figure 4
Figure 4
The AND gate model was parameterized using fluorescence data. The fit to the AND gate transfer function is shown for the B9 clone. Each point represents one experimental data point from the two-dimensional array of inducer combinations (Figure 2). This was compared to the value of G/Gmax calculated using equation (1) and using the values of I1 and I2 from the one-dimensional data (Figure 3). The fit was performed using a non-linear regression algorithm to yield a=50 and b=3000. The Pearson correlation coefficient for the fit is 0.971. The full fit to all of the data is shown in the Supplementary information.
Figure 5
Figure 5
The activity range of the input promoters affects the function of the AND gate circuit. In top panel, the experimental fluorescence of the B9 and F11 gates is shown as a function of I1 and I2. In the bottom panel, the theoretical transfer function (bottom) is calculated using equation (1) and the fit values for the parameters a and b. The white boxes show the ranges for the wild type as well as the F11 and B9 mutants, which have progressively weaker rbss. These boxes are drawn on the basis of range of the one-dimensional transfer functions (Figure 3). It is only the B9 clone that behaves like an AND gate, requiring the maximal activation of both promoters before the output is turned on. In contrast, the F11 clone always shows some activity at high levels of I2, independent of I1.
Figure 6
Figure 6
The modularity of the AND gate was demonstrated by swapping the inputs and output of the circuit. (A) The inputs of the circuit were exchanged with the lux and mgrB promoters. The lux promoter responds to the quorum signal input AI-1 and the mgrB promoter responds to the absence of exogenous magnesium via the PhoPQ two-component system. Only when both promoters are active (in the presence of AI-1 and under magnesium limitation) is the output on. The white bar shows the background fluorescence of E. coli DH10B cells with no plasmids. The plasmids used to obtain these data are pBACr-Mgr940, pSupDLuxR, and pBR939b (Supplementary information). (B) Replacing the output gfp gene with the inv gene results in the invasion of mammalian cells only when both input promoters are on. The invasiveness of the bacteria is equivalent to the expression of inv from a constitutive promoter (white bar). The stars indicate no invasion being detected. In both panels, the error bars show the standard deviation of four replicates. The plasmids used to obtain these data are pSalSer914 and pBACr-Mgr951 (Supplementary information).

References

    1. Ames P, Studdert CA, Reiser RH, Parkinson JS (2002) Collaborative signaling by mixed chemoreceptor teams in Escherichia coli. Proc Natl Acad Sci USA 99: 7060–7065 - PMC - PubMed
    1. Anderson JC, Clarke EJ, Arkin AP, Voigt CA (2006) Environmentally controlled invasion of cancer cells by engineered bacteria. J Mol Biol 355: 619–627 - PubMed
    1. Anderson JC, Magliery TJ, Schultz PG (2002) Exploring the limits of codon and anticodon size. Chem Biol 9: 237–244 - PubMed
    1. Andrianantoandro E, Basu S, Karig DK, Weiss R (2006) Synthetic biology: new engineering rules for an emerging discipline. Mol Syst Biol 2, 2006.0028 10.1038/msb4100073 - PMC - PubMed
    1. Bassler BL, Losick R (2006) Bacterially speaking. Cell 125: 237–246 - PubMed

Publication types

MeSH terms