

Identification of genetic variants contributing to cisplatin-induced cytotoxicity by use of a genomewide approach
- PMID: 17701890
- PMCID: PMC1950832
- DOI: 10.1086/519850
Identification of genetic variants contributing to cisplatin-induced cytotoxicity by use of a genomewide approach
Abstract
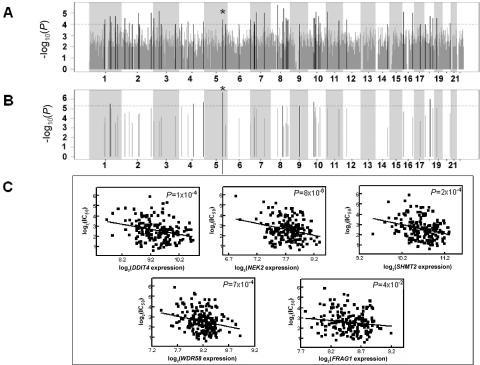
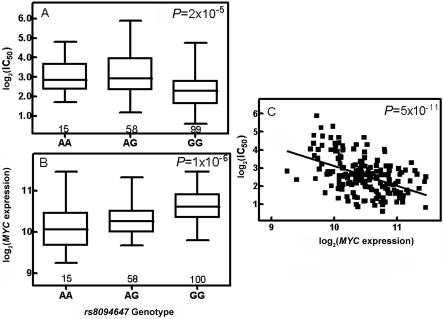
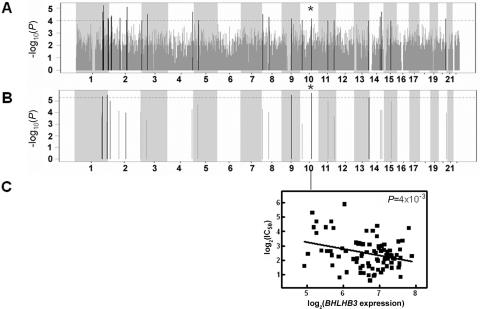
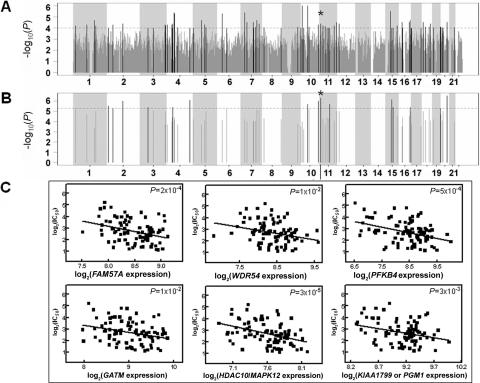
Cisplatin, a platinating agent commonly used to treat several cancers, is associated with nephrotoxicity, neurotoxicity, and ototoxicity, which has hindered its utility. To gain a better understanding of the genetic variants associated with cisplatin-induced toxicity, we present a stepwise approach integrating genotypes, gene expression, and sensitivity of HapMap cell lines to cisplatin. Cell lines derived from 30 trios of European descent (CEU) and 30 trios of African descent (YRI) were used to develop a preclinical model to identify genetic variants and gene expression that contribute to cisplatin-induced cytotoxicity in two different populations. Cytotoxicity was determined as cell-growth inhibition at increasing concentrations of cisplatin for 48 h. Gene expression in 176 HapMap cell lines (87 CEU and 89 YRI) was determined using the Affymetrix GeneChip Human Exon 1.0 ST Array. We identified six, two, and nine representative SNPs that contribute to cisplatin-induced cytotoxicity through their effects on 8, 2, and 16 gene expressions in the combined, Centre d'Etude du Polymorphisme Humain (CEPH), and Yoruban populations, respectively. These genetic variants contribute to 27%, 29%, and 45% of the overall variation in cell sensitivity to cisplatin in the combined, CEPH, and Yoruban populations, respectively. Our whole-genome approach can be used to elucidate the expression of quantitative trait loci contributing to a wide range of cellular phenotypes.
Figures
Similar articles
-
A genome-wide approach to identify genetic variants that contribute to etoposide-induced cytotoxicity.Proc Natl Acad Sci U S A. 2007 Jun 5;104(23):9758-63. doi: 10.1073/pnas.0703736104. Epub 2007 May 30. Proc Natl Acad Sci U S A. 2007. PMID: 17537913 Free PMC article.
-
Genetic variants associated with carboplatin-induced cytotoxicity in cell lines derived from Africans.Mol Cancer Ther. 2008 Sep;7(9):3038-46. doi: 10.1158/1535-7163.MCT-08-0248. Epub 2008 Sep 2. Mol Cancer Ther. 2008. PMID: 18765826 Free PMC article.
-
Effect of population and gender on chemotherapeutic agent-induced cytotoxicity.Mol Cancer Ther. 2007 Jan;6(1):31-6. doi: 10.1158/1535-7163.MCT-06-0591. Mol Cancer Ther. 2007. PMID: 17237264 Free PMC article.
-
Use of CEPH and non-CEPH lymphoblast cell lines in pharmacogenetic studies.Pharmacogenomics. 2005 Apr;6(3):303-10. doi: 10.1517/14622416.6.3.303. Pharmacogenomics. 2005. PMID: 16013961 Review.
-
Genetic and Modifiable Risk Factors Contributing to Cisplatin-induced Toxicities.Clin Cancer Res. 2019 Feb 15;25(4):1147-1155. doi: 10.1158/1078-0432.CCR-18-2244. Epub 2018 Oct 10. Clin Cancer Res. 2019. PMID: 30305294 Free PMC article. Review.
Cited by
-
Meta-analysis on pharmacogenetics of platinum-based chemotherapy in non small cell lung cancer (NSCLC) patients.PLoS One. 2012;7(6):e38150. doi: 10.1371/journal.pone.0038150. Epub 2012 Jun 26. PLoS One. 2012. PMID: 22761669 Free PMC article.
-
HapMap filter 1.0: a tool to preprocess the HapMap genotypic data for association studies.Bioinformation. 2008 May 13;2(8):322-4. doi: 10.6026/97320630002322. Bioinformation. 2008. PMID: 18685717 Free PMC article.
-
Functional consequences of PRPF39 on distant genes and cisplatin sensitivity.Hum Mol Genet. 2012 Oct 1;21(19):4348-55. doi: 10.1093/hmg/dds266. Epub 2012 Jul 5. Hum Mol Genet. 2012. PMID: 22773733 Free PMC article.
-
Genetic variants contributing to daunorubicin-induced cytotoxicity.Cancer Res. 2008 May 1;68(9):3161-8. doi: 10.1158/0008-5472.CAN-07-6381. Cancer Res. 2008. PMID: 18451141 Free PMC article.
-
PACdb: a database for cell-based pharmacogenomics.Pharmacogenet Genomics. 2010 Apr;20(4):269-73. doi: 10.1097/FPC.0b013e328337b8d6. Pharmacogenet Genomics. 2010. PMID: 20216476 Free PMC article.
References
Web Resources
-
- The Coriell Institute for Medical Research, http://www.coriell.org/
-
- GeneCards, http://www.genecards.org/
-
- GEO, http://www.ncbi.nlm.nih.gov/geo/ (for all raw exon array data [accession number GSE7761])
-
- Haploview software, http://www.broad.mit.edu/mpg/haploview/
References
-
- Decatris MP, Sundar S, O’Byrne KJ (2005) Platinum-based chemotherapy in metastatic breast cancer: the Leicester (U.K.) experience. Clin Oncol R Coll Radiol 17:249–257 - PubMed
Publication types
MeSH terms
Substances
Associated data
- Actions
Grants and funding
LinkOut - more resources
Full Text Sources
Other Literature Sources
Molecular Biology Databases
Research Materials
