Comparative Study
. 2007;35(16):e102.
doi: 10.1093/nar/gkm537. Epub 2007 Aug 15.

Filtering genes to improve sensitivity in oligonucleotide microarray data analysis

Affiliations
Comparative Study

Filtering genes to improve sensitivity in oligonucleotide microarray data analysis

Stefano Calza et al. Nucleic Acids Res. 2007.

Abstract

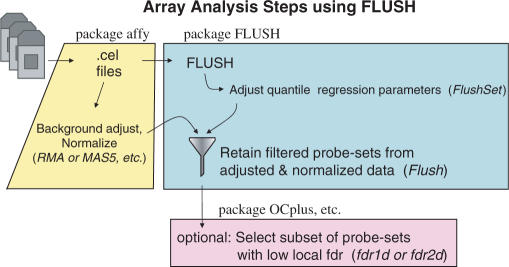
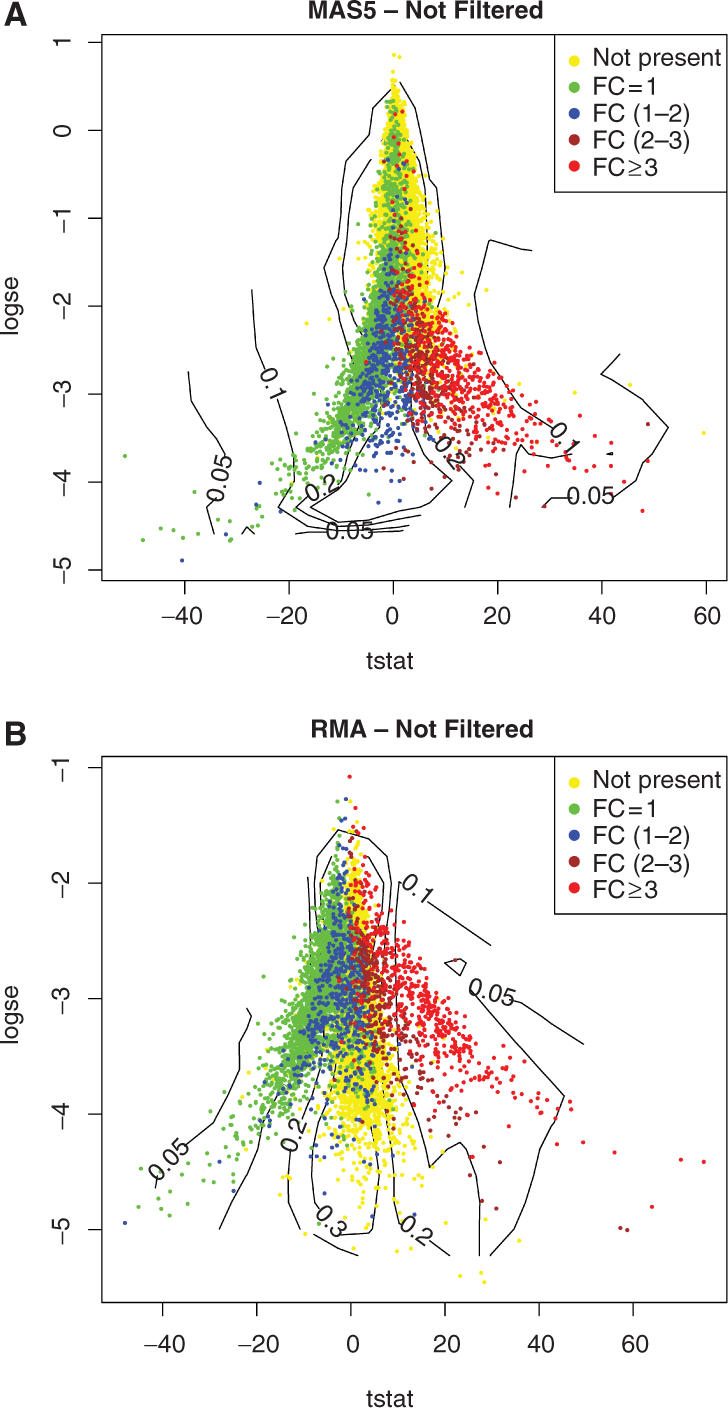
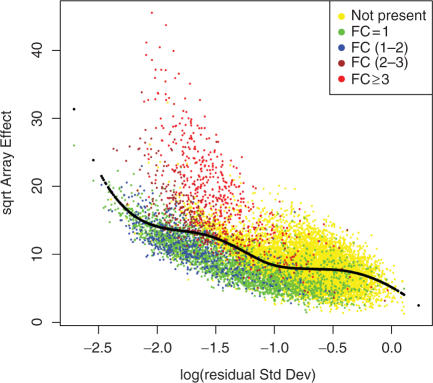
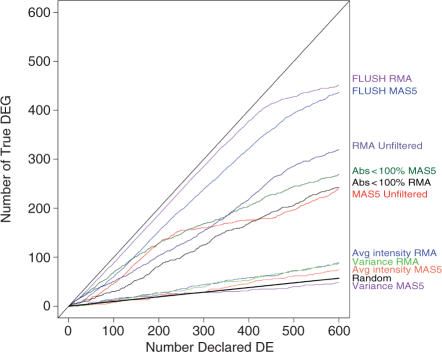
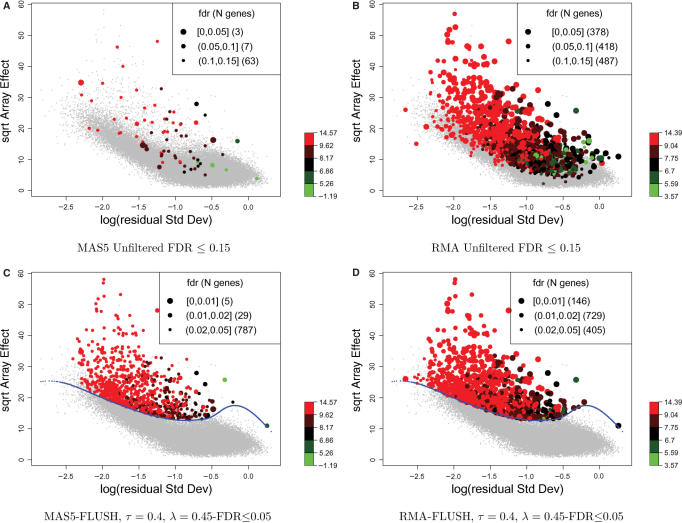
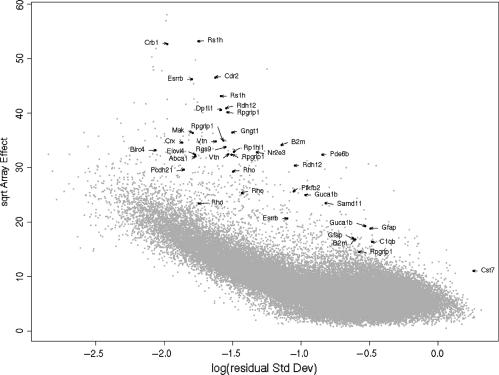
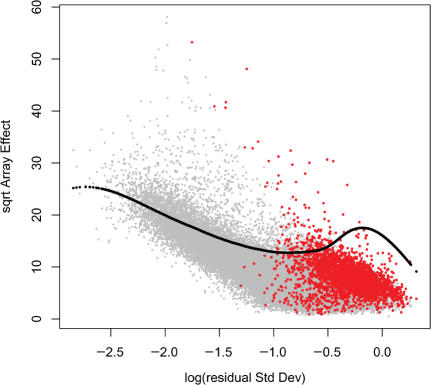
Many recent microarrays hold an enormous number of probe sets, thus raising many practical and theoretical problems in controlling the false discovery rate (FDR). Biologically, it is likely that most probe sets are associated with un-expressed genes, so the measured values are simply noise due to non-specific binding; also many probe sets are associated with non-differentially-expressed (non-DE) genes. In an analysis to find DE genes, these probe sets contribute to the false discoveries, so it is desirable to filter out these probe sets prior to analysis. In the methodology proposed here, we first fit a robust linear model for probe-level Affymetrix data that accounts for probe and array effects. We then develop a novel procedure called FLUSH (Filtering Likely Uninformative Sets of Hybridizations), which excludes probe sets that have statistically small array-effects or large residual variance. This filtering procedure was evaluated on a publicly available data set from a controlled spiked-in experiment, as well as on a real experimental data set of a mouse model for retinal degeneration. In both cases, FLUSH filtering improves the sensitivity in the detection of DE genes compared to analyses using unfiltered, presence-filtered, intensity-filtered and variance-filtered data. A freely-available package called FLUSH implements the procedures and graphical displays described in the article.


Figures

Figure 1.
Figure 1.
Flow-chart of the work flow using FLUSH. The whole data are background-corrected, normalized and summarized using any algorithm, e.g. MAS5, RMA, etc. The raw data are processed with FLUSH in order to identify probe sets to be removed in the subsequent analysis. Identified probes are discarded from the expression matrix prior to DE analysis.
Figure 2.
Figure 2.
TSE plot for (A) MAS5 and (B) RMA unfiltered values. This plot shows the standard t-statistic on the x-axis and the standard error (in log scale) on the y-axis with additional local fdr isolines (i.e. lines connecting points with the same local fdr value).
Figure 3.
Figure 3.
RA-plot for Golden Spike data. This plot shows the array-to-array variability versus residual variance from the probe-level linear model. The black line represents the fitted values from a quantile regression with τ = 0.6.
Figure 4.
Figure 4.
Cumulative distribution of true DE genes versus number of genes declared DE for the various filtering procedures. Criteria for the presence call, average intensity and variance filtering were chosen in order to retain a number of features comparable to the FLUSH method (5 610 genes). Presence-call filtering retained features with at least one presence or marginal call among the six samples (Abs < 100%, 4 899 genes). Both average intensity and variance methods filtered out 60% of genes (5 604 genes kept). The straight line labeled as ‘Random’ represents the expected number of DE identified through a random selection of genes. R is defined as the number of genes declared significant, the number of TDE may be computed as (1−π0)*R, where π0 represents the proportion of non-DE genes. In the Golden Spike data π0 = 90.5%.
Figure 5.
Figure 5.
Filtering of probe sets from a mouse model of retinal degeneration. (A) and (B) show RA-plots for both MAS5 and RMA unfiltered probe sets. Features with fdr < 0.15 have point size related to fdr values with larger dots having smaller fdr. (C) and (D) show the corresponding plots for filtered probe sets. Quantile-regression smoothing was fitted with τ = 0.4 and λ = 0.45. Features with fdr < 0.05 have point size related to fdr values with larger dots having smaller fdr. In all plots, points are colored according to the average intensity computed either on MAS5 or RMA expression values (on logarithmic scale).
Figure 6.
Figure 6.
RA-plots of the retina degradation data, where we highlight the probe sets known or suggested to be differentially regulated in rd1 mouse retina at post-natal day 15. Such probe sets are plotted as solid black points and marked with their respective gene symbol.
Figure 7.
Figure 7.
RA-plot of the retina degradation data, where we highlight the probe sets (red points) retained by the variance filtering. In view of Figure 3, these probe sets are likely to correspond to unexpressed genes.

References

    1. Su AI, Cooke MP, Ching KA, Hakak Y, Walker JR, Wiltshire T, Orth AP, Vega RG, Sapinoso LM, et al. Large-scale analysis of the human and mouse transcriptomes. PNAS. 2002;99:4465–4470. - PMC - PubMed
    1. Jongeneel CV, Iseli C, Stevenson BJ, Riggins GJ, Lal A, Mackay A, Harris RA, O'H;are MJ, Neville AM, et al. Comprehensive sampling of gene expression in human cell lines with massively parallel signature sequencing. PNAS. 2003;100:4702–4705. - PMC - PubMed
    1. Dabney A, Storey J. A reanalysis of a published affymetrix genechip control dataset. Gen. Biol. 2006;7:401. - PMC - PubMed
    1. Modlich O, Prisack H-B, Munnes M, Audretsch W, Bojar H. Immediate gene expression changes after the first course of neoadjuvant chemotherapy in patients with primary breast cancer disease. Clin. Cancer Res. 2004;10:6418–6431. - PubMed
    1. Welsh JB, Zarrinkar PP, Sapinoso LM, Kern SG, Behling CA, Monk BJ, Lockhart DJ, Burger RA, Hampton GM. Analysis of gene expression profiles in normal and neoplastic ovarian tissue samples identifies candidate molecular markers of epithelial ovarian cancer. PNAS. 2001;98:1176–1181. - PMC - PubMed

Publication types

Substances