Multicolor super-resolution imaging with photo-switchable fluorescent probes
- PMID: 17702910
- PMCID: PMC2633025
- DOI: 10.1126/science.1146598
Multicolor super-resolution imaging with photo-switchable fluorescent probes
Abstract
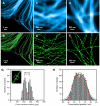
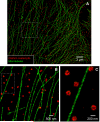
Recent advances in far-field optical nanoscopy have enabled fluorescence imaging with a spatial resolution of 20 to 50 nanometers. Multicolor super-resolution imaging, however, remains a challenging task. Here, we introduce a family of photo-switchable fluorescent probes and demonstrate multicolor stochastic optical reconstruction microscopy (STORM). Each probe consists of a photo-switchable "reporter" fluorophore that can be cycled between fluorescent and dark states, and an "activator" that facilitates photo-activation of the reporter. Combinatorial pairing of reporters and activators allows the creation of probes with many distinct colors. Iterative, color-specific activation of sparse subsets of these probes allows their localization with nanometer accuracy, enabling the construction of a super-resolution STORM image. Using this approach, we demonstrate multicolor imaging of DNA model samples and mammalian cells with 20- to 30-nanometer resolution. This technique will facilitate direct visualization of molecular interactions at the nanometer scale.
Figures


Similar articles
-
Three-dimensional super-resolution imaging by stochastic optical reconstruction microscopy.Science. 2008 Feb 8;319(5864):810-3. doi: 10.1126/science.1153529. Epub 2008 Jan 3. Science. 2008. PMID: 18174397 Free PMC article.
-
Multicolor super-resolution fluorescence imaging via multi-parameter fluorophore detection.Chemphyschem. 2012 Jan 16;13(1):99-107. doi: 10.1002/cphc.201100735. Epub 2011 Dec 23. Chemphyschem. 2012. PMID: 22213647 Free PMC article.
-
Super-resolution microscopy by nanoscale localization of photo-switchable fluorescent probes.Curr Opin Chem Biol. 2008 Oct;12(5):505-14. doi: 10.1016/j.cbpa.2008.08.008. Curr Opin Chem Biol. 2008. PMID: 18809508 Free PMC article. Review.
-
FALCON: fast and unbiased reconstruction of high-density super-resolution microscopy data.Sci Rep. 2014 Apr 3;4:4577. doi: 10.1038/srep04577. Sci Rep. 2014. PMID: 24694686 Free PMC article.
-
Zooming in on biological processes with fluorescence nanoscopy.Curr Opin Biotechnol. 2013 Aug;24(4):646-53. doi: 10.1016/j.copbio.2013.02.016. Epub 2013 Mar 13. Curr Opin Biotechnol. 2013. PMID: 23498844 Review.
Cited by
-
Rapid spectral-domain localization.Opt Express. 2013 May 20;21(10):12822-30. doi: 10.1364/OE.21.012822. Opt Express. 2013. PMID: 23736501 Free PMC article.
-
Ultrabright photoactivatable fluorophores created by reductive caging.Nat Methods. 2012 Dec;9(12):1181-4. doi: 10.1038/nmeth.2214. Epub 2012 Oct 28. Nat Methods. 2012. PMID: 23103881 Free PMC article.
-
Faster STORM using compressed sensing.Nat Methods. 2012 Apr 22;9(7):721-3. doi: 10.1038/nmeth.1978. Nat Methods. 2012. PMID: 22522657 Free PMC article.
-
Getting the Most Out of Fluorogenic Probes: Challenges and Opportunities in Using Single-Molecule Fluorescence to Image Electro- and Photocatalysis.Chem Biomed Imaging. 2023 Oct 23;1(8):692-715. doi: 10.1021/cbmi.3c00075. eCollection 2023 Nov 27. Chem Biomed Imaging. 2023. PMID: 38037609 Free PMC article. Review.
-
Peptide-PAINT Using a Transfected-Docker Enables Live- and Fixed-Cell Super-Resolution Imaging.Small Methods. 2023 Apr;7(4):e2201181. doi: 10.1002/smtd.202201181. Epub 2023 Feb 3. Small Methods. 2023. PMID: 36734194 Free PMC article.
References
Publication types
MeSH terms
Substances
Grants and funding
LinkOut - more resources
Full Text Sources
Other Literature Sources

