Review
. 2007 Sep;8(9):699-710.
doi: 10.1038/nrg2144.

Integrating physical and genetic maps: from genomes to interaction networks

Affiliations
Review

Integrating physical and genetic maps: from genomes to interaction networks

Andreas Beyer et al. Nat Rev Genet. 2007 Sep.

Abstract

Physical and genetic mapping data have become as important to network biology as they once were to the Human Genome Project. Integrating physical and genetic networks currently faces several challenges: increasing the coverage of each type of network; establishing methods to assemble individual interaction measurements into contiguous pathway models; and annotating these pathways with detailed functional information. A particular challenge involves reconciling the wide variety of interaction types that are currently available. For this purpose, recent studies have sought to classify genetic and physical interactions along several complementary dimensions, such as ordered versus unordered, alleviating versus aggravating, and first versus second degree.


Figures
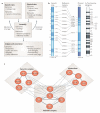
Figure 1
Figure 1. Genetic and physical mapping for networks and genomes
a ∣ The assembly and analysis of genetic and physical interaction networks runs parallel to the procedures that were previously developed for assembly and analysis of DNA sequences. b ∣ An integrated map of human chromosome X. Markers are listed in the centre column, with genetic distances given on the left in centimorgans (cM) and physical distances given on the right in centirays (cR). c ∣ An integrated map of genetic and physical interactions for the yeast cytoskeleton. Solid lines represent physical protein–protein interactions, and dashed lines represent synthetic-lethal genetic interactions. The physical network defines three complexes: prefoldin, dynactin and the kinetochore, whereas the genetic network defines functional dependencies between prefoldin and dynactin or the kinetochore, respectively. Part b reproduced with permission from the Cancer Genome Anatomy Project © (2007) National Cancer Institute (USA). Part c modified with permission from Nature Biotechnology REF. © (2005) Macmillan Publishers Ltd.
Figure 2
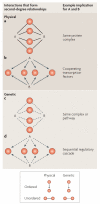
Figure 2. Second-degree interactions imply first-degree relationships
The four example networks (panels a–d) illustrate ways in which second-degree interactions between two proteins, A and B, can imply new first-degree relationships that are complementary to the original experimental data. For protein–protein interactions (panel a), a second-degree interaction implies that A and B are in the same complex. For transcription factor–DNA interactions (panel b), A and B are possibly heterodimeric transcription factors that regulate a common set of genes. For aggravating genetic interactions (panel c), a second-degree interaction between A and B occurs if these proteins have common genetic interaction partners, implying that they act in the same pathway. For ordered genetic interactions (panel d), a second-degree interaction exists if mutations to A and B affect a common set of downstream genes or phenotypes, also suggesting that A and B act sequentially in a pathway.
Figure 3
Figure 3. Examples of assembly across different interaction categories
a ∣ Members of the cohesin complex are regulated by Swi6 and Mbp1 transcription factors, which themselves are parallel members of the MBF transcriptional complex. b ∣ Genetic interactions generated by synthetic-lethality screens identify parallel components of the Cdc14 release pathway, including members of the FEAR pathway, the MEN pathway and the Sin3–Rpd3 complex. c ∣ Identification of putative Hsp90 substrates through combined yeast two-hybrid (Y2H) and tandem affinity purification coupled with mass spectrometry (TAP–MS) screening, and synthetic genetic array (SGA) and chemogenomic profiling using an Hsp90 inhibitor. d ∣ Data that were obtained using chromatin immunoprecipitation combined with microarrays (ChIP–chip) were used to show that the transcription factors Hir1 and Hir2 regulate multiple members of a chromatin-related complex. e ∣ Members of a SHU complex (Shu1, Shu2, Csm2 and Psy3) are interconnected by coequal genetic interactions and show epistatic ordering with both Sgs1 and Rad54 in the DNA recombination/repair pathway. Part a modified with permission from REF. © (2007) National Academy of Sciences (USA). Part b modified with permission from Molecular Systems Biology REF. © (2005) Macmillan Publishers Ltd. Part c modified with permission from REF. © (2005) Elsevier Sciences. Part d modified with permission from REF. © (2005) Biomed Central. Part e reproduced with permission from Nature Genetics REF. © (2007) Macmillan Publishers Ltd.
Figure 4
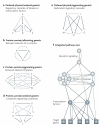
Figure 4. Network motifs assembled from different combinations of interaction measurements
Physical interactions are shown as solid lines and arrows, and genetic interactions are shown as dashed lines and arrows. Part a shows an example of integrating ordered physical versus ordered genetic interactions, in which knockout of A or B results in changes in the activity of C, D and E (ordered genetic interactions), which are brought about because of changes in transcriptional activity or kinase–substrate binding (ordered physical interactions),,,. Members of protein complexes (protein–protein interactions) can be connected by genetic interactions either within complexes (shown in part b) or between complexes (shown in part c) -,,,. In part d, members of a complex made up of F–G (protein–protein interactions) operate upstream of or epistatically to (ordered genetic) the complex H–I–J,. In part e, regulatory factors K and L cooperate to activate targets M, N and O (ordered physical) which function in parallel pathways (alleviating genetic46,51,66). Part f shows how the motifs of previous panels might combine within a still larger network, starting at a receptor protein and ending at transcription factors modulating the expression of target genes. Note that the motifs in each panel are summarized from the literature (see references provided) and are not intended as an exhaustive catalogue of all ways of integrating interactions.

Similar articles

Cited by

References

    1. Yu A, et al. Comparison of human genetic and sequence-based physical maps. Nature. 2001;409:951–953. - PubMed
    1. Sturtevant AH. The linear arrangement of six sex-linked factors in Drosophila, as shown by their mode of association. J. Exp. Zool. 1913;14:43–59.
    1. Goss SJ, Harris H. New method for mapping genes in human chromosomes. Nature. 1975;255:680–684. - PubMed
    1. Cox DR, Burmeister M, Price ER, Kim S, Myers RM. Radiation hybrid mapping: a somatic cell genetic method for constructing high-resolution maps of mammalian chromosomes. Science. 1990;250:245–250. - PubMed
    1. Fauth C, Speicher MR. Classifying by colors: FISH-based genome analysis. Cytogenet. Cell Genet. 2001;93:1–10. - PubMed

Publication types