

Phase transitions of the coupled membrane-cytoskeleton modify cellular shape
- PMID: 17704150
- PMCID: PMC2084237
- DOI: 10.1529/biophysj.107.113282
Phase transitions of the coupled membrane-cytoskeleton modify cellular shape
Abstract
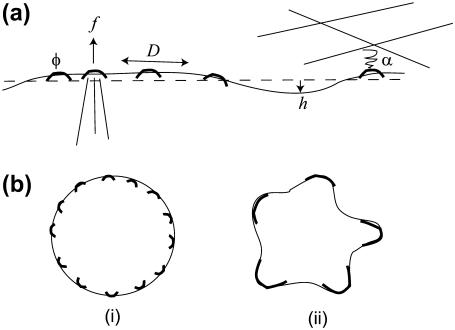
Formation of protrusions and protein segregation on the membrane is of a great importance for the functioning of the living cell. This is most evident in recent experiments that show the effects of the mechanical properties of the surrounding substrate on cell morphology. We propose a mechanism for the formation of membrane protrusions and protein phase separation, which may lay behind this effect. In our model, the fluid cell membrane has a mobile but constant population of proteins with a convex spontaneous curvature. Our basic assumption is that these membrane proteins represent small adhesion complexes, and also include proteins that activate actin polymerization. Such a continuum model couples the membrane and protein dynamics, including cell-substrate adhesion and protrusive actin force. Linear stability analysis shows that sufficiently strong adhesion energy and actin polymerization force can bring about phase separation of the membrane protein and the appearance of protrusions. Specifically, this occurs when the spontaneous curvature and aggregation potential alone (passive system) do not cause phase separation. Finite-size patterns may appear in the regime where the spontaneous curvature energy is a strong factor. Different instability characteristics are calculated for the various regimes, and are compared to various types of observed protrusions and phase separations, both in living cells and in artificial model systems. A number of testable predictions are proposed.
Figures


Similar articles
-
Membrane waves driven by actin and Myosin.Phys Rev Lett. 2007 Apr 20;98(16):168103. doi: 10.1103/PhysRevLett.98.168103. Epub 2007 Apr 20. Phys Rev Lett. 2007. PMID: 17501468
-
Calcium-actin waves and oscillations of cellular membranes.Biophys J. 2009 Sep 16;97(6):1558-68. doi: 10.1016/j.bpj.2009.07.008. Biophys J. 2009. PMID: 19751660 Free PMC article.
-
Mediation, modulation, and consequences of membrane-cytoskeleton interactions.Annu Rev Biophys. 2008;37:65-95. doi: 10.1146/annurev.biophys.37.032807.125912. Annu Rev Biophys. 2008. PMID: 18573073 Review.
-
Membrane Mechanics of Endocytosis in Cells with Turgor.PLoS Comput Biol. 2015 Oct 30;11(10):e1004538. doi: 10.1371/journal.pcbi.1004538. eCollection 2015 Oct. PLoS Comput Biol. 2015. PMID: 26517669 Free PMC article.
-
Rho GTPases and actin dynamics in membrane protrusions and vesicle trafficking.Trends Cell Biol. 2006 Oct;16(10):522-9. doi: 10.1016/j.tcb.2006.08.006. Epub 2006 Sep 1. Trends Cell Biol. 2006. PMID: 16949823 Review.
Cited by
-
Propagating cell-membrane waves driven by curved activators of actin polymerization.PLoS One. 2011 Apr 21;6(4):e18635. doi: 10.1371/journal.pone.0018635. PLoS One. 2011. PMID: 21533032 Free PMC article.
-
Mechanical and Electrical Interaction of Biological Membranes with Nanoparticles and Nanostructured Surfaces.Membranes (Basel). 2021 Jul 14;11(7):533. doi: 10.3390/membranes11070533. Membranes (Basel). 2021. PMID: 34357183 Free PMC article. Review.
-
Signaling networks and cell motility: a computational approach using a phase field description.J Math Biol. 2014 Jul;69(1):91-112. doi: 10.1007/s00285-013-0704-4. Epub 2013 Jul 9. J Math Biol. 2014. PMID: 23835784
-
Physical model of contractile ring initiation in dividing cells.Biophys J. 2008 Feb 15;94(4):1155-68. doi: 10.1529/biophysj.107.111351. Epub 2007 Nov 2. Biophys J. 2008. PMID: 17981905 Free PMC article.
-
Exploring the binding dynamics of BAR proteins.Cell Mol Biol Lett. 2011 Sep;16(3):398-411. doi: 10.2478/s11658-011-0013-0. Epub 2011 May 25. Cell Mol Biol Lett. 2011. PMID: 21614490 Free PMC article.
References
-
- Revenu, C., R. Athman, S. Robine, and D. Louvard. 2004. The co-workers of actin filaments: from cell structures to signals. Nat. Rev. Mol. Cell Biol. 5:1–12. - PubMed
-
- Brown, E. J. 2002. Integrin-associated proteins. Curr. Opin. Cell Biol. 14:603–607. - PubMed
-
- Schirenbeck, A., R. Arasada, T. Bretschneider, M. Schleicher, and J. Faix. 2005. Formins and VASPs may co-operate in the formation of filopodia. Biochem. Soc. Trans. 33:1256–1259. - PubMed
-
- Belyantseva, I. A., E. T. Boger, S. Naz, G. I. Frolenkov, J. R. Sellers, Z. M. Ahmed, A. J. Griffith, and T. B. Friedman. 2005. Myosin-XVa is required for tip localization of whirlin and differential elongation of hair-cell stereocilia. Nat. Cell Biol. 7:148–156. - PubMed
Publication types
MeSH terms
Substances
LinkOut - more resources
Full Text Sources
