. 2007 Dec 15;371(2):173-83.
doi: 10.1016/j.ab.2007.07.017. Epub 2007 Jul 26.

A continuous fluorometric assay for the assessment of MazF ribonuclease activity

Affiliations

A continuous fluorometric assay for the assessment of MazF ribonuclease activity

Nora R Wang et al. Anal Biochem. .

Abstract

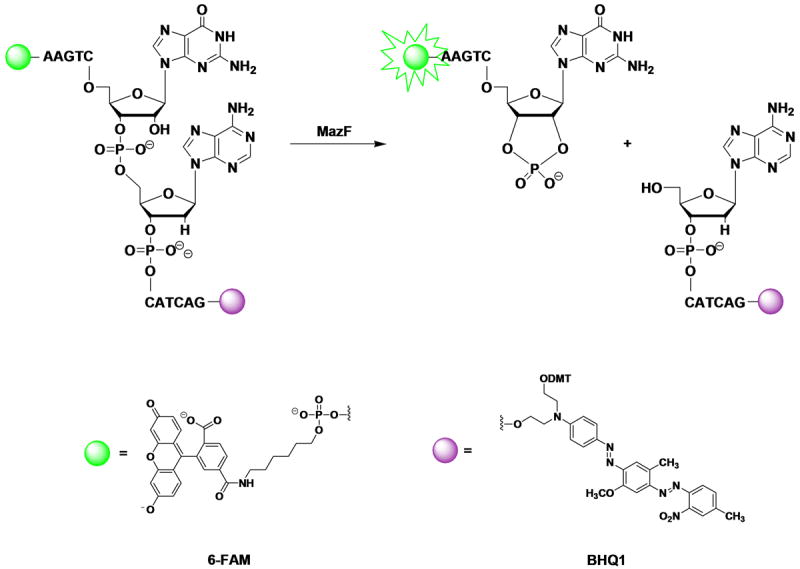
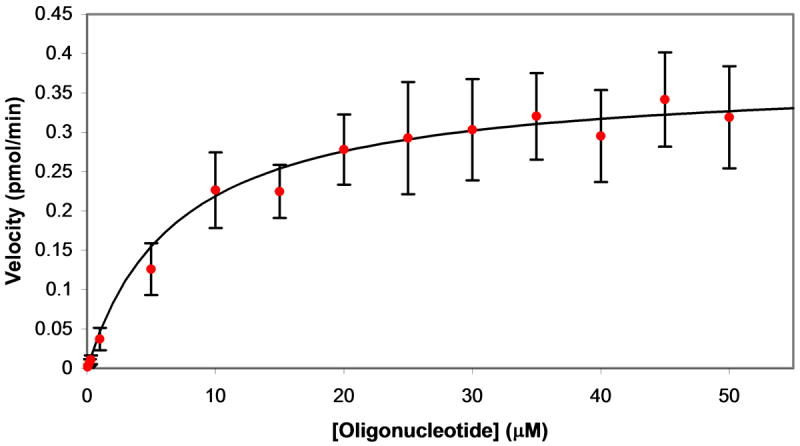
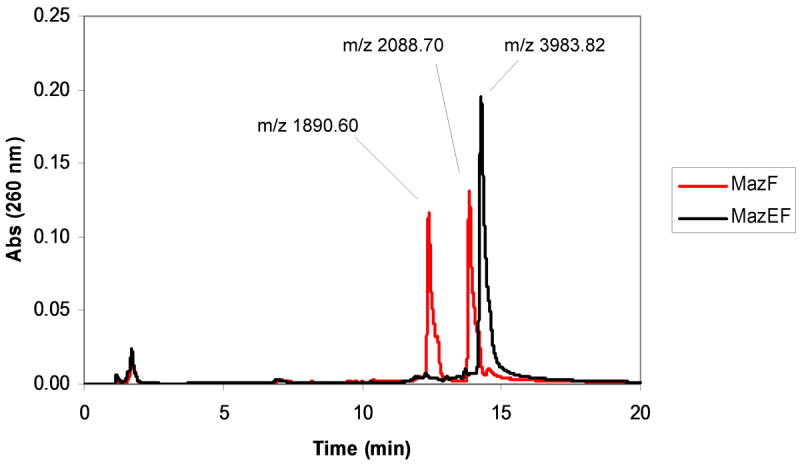
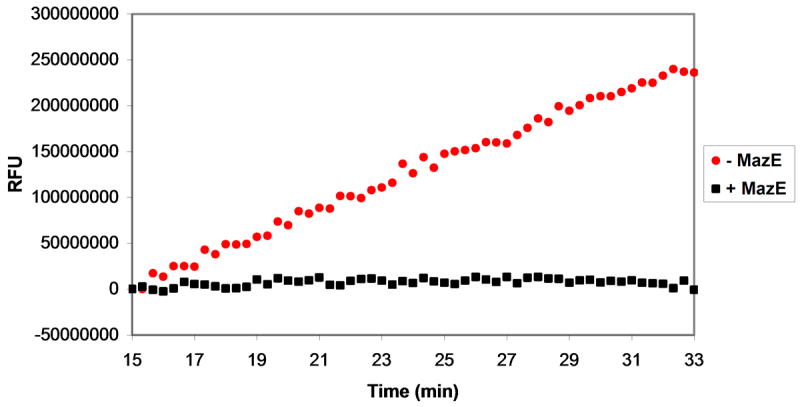
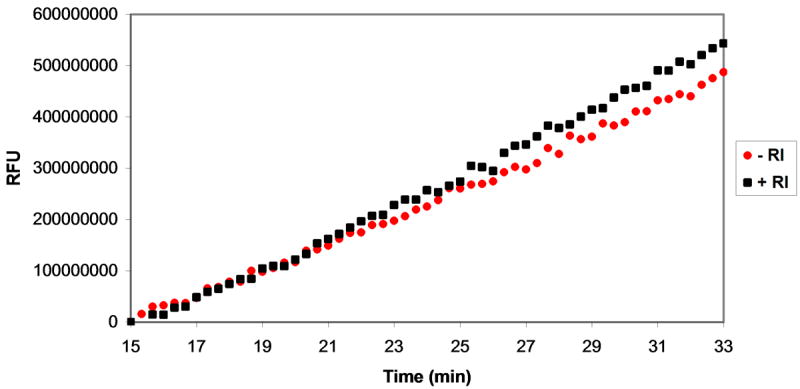
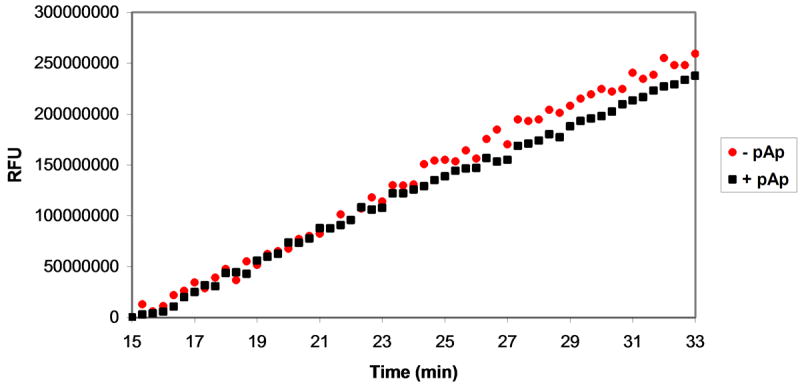
Plasmids maintain themselves in their bacterial host through several different mechanisms, one of which involves the synthesis of plasmid-encoded toxin and antitoxin proteins. When the plasmid is present, the antitoxin binds to and neutralizes the toxin. If a plasmid-free daughter cell arises, however, the labile antitoxin is degraded (and not replenished) and the toxin kills the cell from within. These toxin-antitoxin (TA) systems thereby function as postsegregational killing systems, and the disruption of the TA interaction represents an intriguing antibacterial strategy. It was recently discovered that the genes for one particular TA system, MazEF, are ubiquitous on plasmids isolated from clinical vancomycin-resistant enterococci (VRE) strains. Thus, it appears that small molecule disruptors of the MazEF interaction have potential as antibacterial agents. The MazF toxin protein is known to be a ribonuclease. Unfortunately, traditional methods for the assessment of MazF activity rely on the use of radiolabeled substrates followed by analysis with polyacrylamide gel electrophoresis. This article describes a simple and convenient continuous assay for the assessment of MazF activity. The assay uses an oligonucleotide with a fluorophore on the 5' end and a quencher on the 3' end, and processing of this substrate by MazF results in a large increase in the fluorescence signal. Through this assay, we have for the first time determined K(M) and V(max) values for this enzyme and have also found that MazF is not inhibited by standard ribonuclease inhibitors. This assay will be useful to those interested in the biochemistry of the MazF family of toxins and the disruption of MazE/MazF.


Figures

Figure 1
Figure 1
Substrate design. A chimeric DNA/RNA oligonucleotide (5′-AAGTCrGACATCAG-3′) previously shown to be cleaved by MazF was labeled with 6-carboxyfluorescein (6-FAM) on the 5′-end and with Black Hole Quencher 1 (BHQ1) on the 3′-end. When the oligonucleotide is intact, BHQ1 quenches the fluorescence of 6-FAM; however, cleavage of the oligonucleotide at the RNA base by MazF releases 6-FAM from BHQ1, thereby increasing the fluorescence of 6-FAM.
Figure 2
Figure 2
Construction of a calibration curve. Labeled oligonucleotides corresponding to products formed by cleavage of the fluorescently-labeled oligonucleotide substrate by MazF were mixed at 1:1 molar ratios for various concentrations. Fluorescence values for these 1:1 mixtures in elution buffer were measured upon excitation at 485 nm and emission at 530 nm allowing a calibration curve to be constructed that relates fluorescence to the amount of oligonucleotide cleaved. Calibration curves were linear up to 60 pmol (2 μM) of each cleavage fragment; a calibration curve was constructed in parallel with every experiment.
Figure 3
Figure 3
Determination of kinetic parameters for substrate cleavage by MazF. MazF (final concentration of 3 μM) was added to various concentrations of oligonucleotide substrate and fluorescence was monitored upon excitation at 485 nm and emission at 530 nm. A. Data analysis began 15 minutes after addition of MazF or elution buffer. The change in 6-FAM emission with reaction progress is shown for addition of MazF (red circles) and elution buffer (black squares) to a solution of 20 μM of the fluorescently-labeled chimeric substrate. Data for elution buffer addition was then subtracted from that for MazF addition and the resulting data were used to construct the plots shown in B. B. Linear regression analysis was performed on the background-subtracted data set for each oligonucleotide substrate concentration. Shown are data sets for substrate at 40 μM (filled yellow diamonds), 10 μM (filled green squares), 5 μM (filled blue triangles), 1 μM (filled red circles), and 0.3 μM (empty purple diamonds). C. The slopes from the data sets shown in B were plotted against oligonucleotide substrate concentration. Reaction velocities were determined for three separate batches of purified MazF and average velocities are plotted. Error bars represent the standard deviation from the mean. The Michaelis-Menten equation was fit to the data for substrate concentrations ≤ 0.3 μM and ≥ 20 μM; from the curve fit, Vmax = 0.37 ± 0.02 pmol/min, and KM = 6.9 ± 1.9 μM.
Figure 3
Figure 3
Determination of kinetic parameters for substrate cleavage by MazF. MazF (final concentration of 3 μM) was added to various concentrations of oligonucleotide substrate and fluorescence was monitored upon excitation at 485 nm and emission at 530 nm. A. Data analysis began 15 minutes after addition of MazF or elution buffer. The change in 6-FAM emission with reaction progress is shown for addition of MazF (red circles) and elution buffer (black squares) to a solution of 20 μM of the fluorescently-labeled chimeric substrate. Data for elution buffer addition was then subtracted from that for MazF addition and the resulting data were used to construct the plots shown in B. B. Linear regression analysis was performed on the background-subtracted data set for each oligonucleotide substrate concentration. Shown are data sets for substrate at 40 μM (filled yellow diamonds), 10 μM (filled green squares), 5 μM (filled blue triangles), 1 μM (filled red circles), and 0.3 μM (empty purple diamonds). C. The slopes from the data sets shown in B were plotted against oligonucleotide substrate concentration. Reaction velocities were determined for three separate batches of purified MazF and average velocities are plotted. Error bars represent the standard deviation from the mean. The Michaelis-Menten equation was fit to the data for substrate concentrations ≤ 0.3 μM and ≥ 20 μM; from the curve fit, Vmax = 0.37 ± 0.02 pmol/min, and KM = 6.9 ± 1.9 μM.
Figure 4
Figure 4
Verification of substrate cleavage by HPLC. Products from a 5 hour incubation of 24 μM unlabeled chimeric oligonucleotide (5′-AAGTCrGACATCAG-3′) with 11.5 μM MazF(His)6 in the presence (black) and absence (red) of 5.75 μM MazE were observed by HPLC analysis. Peak fractions were analyzed by MALDI mass spectrometry. The peak at longest retention time corresponds to intact oligonucleotide (calculated MW = 3983.6). The peaks at shorter retention times correspond to 5′- and 3′-fragments generated from MazF cleavage (calculated MW = 1894.2 and 2088.4, respectively).
Figure 5
Figure 5
Assessment of MazF activity in the presence of ribonuclease inhibitors. Various ribonuclease inhibitors were added to MazF and elution buffer prior to their addition to oligonucleotide substrate. The effects of inhibitors on reaction velocity were monitored by fluorescence quantification by excitation at 485 nm and emission at 530 nm. A. A mixture of MazF and MazE was added to oligonucleotide substrate to final concentrations of 3 μM MazF and 1.5 μM MazE. Inhibition of MazF by MazE is indicated by the static fluorescence observed after MazF/MazE addition (black squares) in comparison to the increase in fluorescence observed after addition of MazF alone (red circles). B. A MazF/ribonuclease inhibitor (RI) solution was added to oligonucleotide substrate to final concentrations of 3 μM MazF and 200U RI. No inhibition of MazF by RI is observed as the fluorescence change of the oligonucleotide/MazF solution is the same in the presence and absence of RI. C. An experiment similar to that described in B was repeated for the RNaseA inhibitor, adenosine 3′,5′-diphosphate (pAp). Again, no inhibition of MazF by pAp is observed as the fluorescence change of the reaction solution is the same in the presence or absence of 1 mM pAp.
Figure 5
Figure 5
Assessment of MazF activity in the presence of ribonuclease inhibitors. Various ribonuclease inhibitors were added to MazF and elution buffer prior to their addition to oligonucleotide substrate. The effects of inhibitors on reaction velocity were monitored by fluorescence quantification by excitation at 485 nm and emission at 530 nm. A. A mixture of MazF and MazE was added to oligonucleotide substrate to final concentrations of 3 μM MazF and 1.5 μM MazE. Inhibition of MazF by MazE is indicated by the static fluorescence observed after MazF/MazE addition (black squares) in comparison to the increase in fluorescence observed after addition of MazF alone (red circles). B. A MazF/ribonuclease inhibitor (RI) solution was added to oligonucleotide substrate to final concentrations of 3 μM MazF and 200U RI. No inhibition of MazF by RI is observed as the fluorescence change of the oligonucleotide/MazF solution is the same in the presence and absence of RI. C. An experiment similar to that described in B was repeated for the RNaseA inhibitor, adenosine 3′,5′-diphosphate (pAp). Again, no inhibition of MazF by pAp is observed as the fluorescence change of the reaction solution is the same in the presence or absence of 1 mM pAp.
Figure 6
Figure 6
High-throughput screen simulation. A 12.5 nM solution of the fluorescently-labeled oligonucleotide substrate was incubated in wells of a 384-well plate filled with either MazE:MazF(His)6 (1.5 μM:3.0 μM) or MazF(His)6 (3 μM). Control wells were prepared in column 24 in which oligonucleotide was incubated in the absence of compound with elution buffer (dark grey), MazE:MazF(His)6 (1.5 μM:3.0 μM; light grey), and MazF(His)6 (red). After a 2.5 hr incubation, wells containing MazF(His)6 (M3, J7, G13, and C18) are easily distinguished from those that contain MazE/MazF(His)6. These results demonstrate that the fluorescent oligonucleotide substrate could be used to detect MazEF complex disruptors in a high-throughput screen.

Similar articles

Cited by

References

    1. Zielenkiewicz U, Ceglowski P. Mechanisms of plasmid stable maintenance with special focus on plasmid addiction systems. Acta Biochim Pol. 2001;4:1003–1023. - PubMed
    1. Gerdes K, Christensen SK, Lobner-Olesen A. Prokaryotic toxin-antitoxin stress response loci. Nat Rev Microbiol. 2005;5:371–382. - PubMed
    1. Hayes F. Toxins-antitoxins: plasmid maintenance, programmed cell death, and cell cycle arrest. Science. 2003;5639:1496–1499. - PubMed
    1. Pandey DP, Gerdes K. Toxin-antitoxin loci are highly abundant in free-living but lost from host-associated prokaryotes. Nucleic Acids Res. 2005;3:966–976. - PMC - PubMed
    1. Moritz EM, Hergenrother PJ. Toxin-antitoxin systems are ubiquitous and plasmid-encoded in vancomycin-resistant enterococci. Proc Natl Acad Sci U S A. 2007;1:311–6. - PMC - PubMed

Publication types

MeSH terms

LinkOut - more resources