. 2007 Nov;132(1-2):154-68.
doi: 10.1016/j.pain.2007.06.026. Epub 2007 Aug 15.

Morphine treatment accelerates sarcoma-induced bone pain, bone loss, and spontaneous fracture in a murine model of bone cancer

Affiliations

Morphine treatment accelerates sarcoma-induced bone pain, bone loss, and spontaneous fracture in a murine model of bone cancer

Tamara King et al. Pain. 2007 Nov.

Abstract

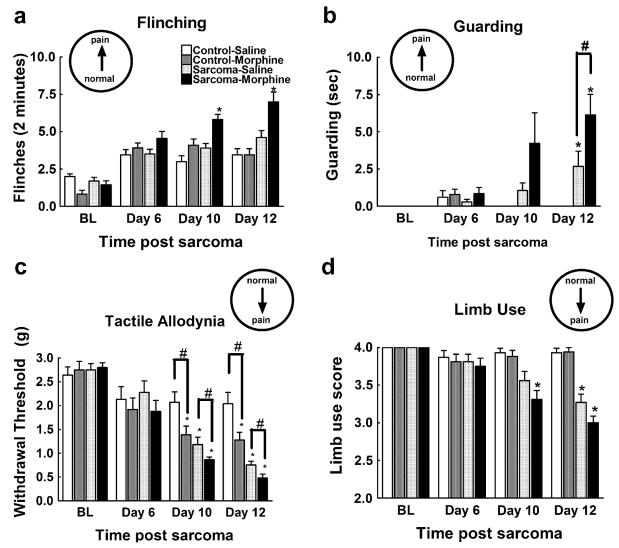
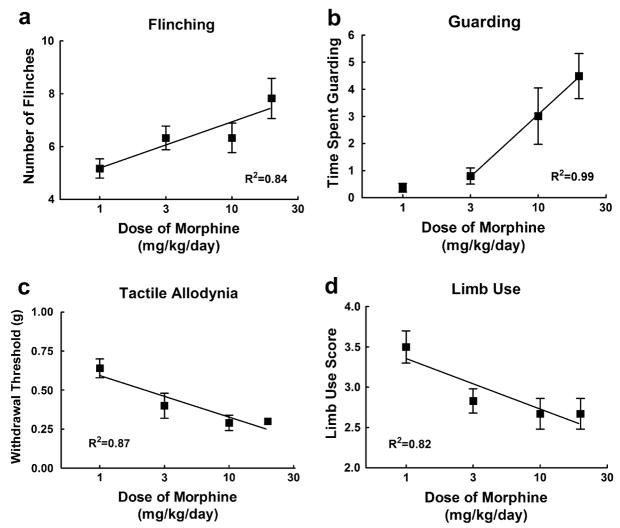
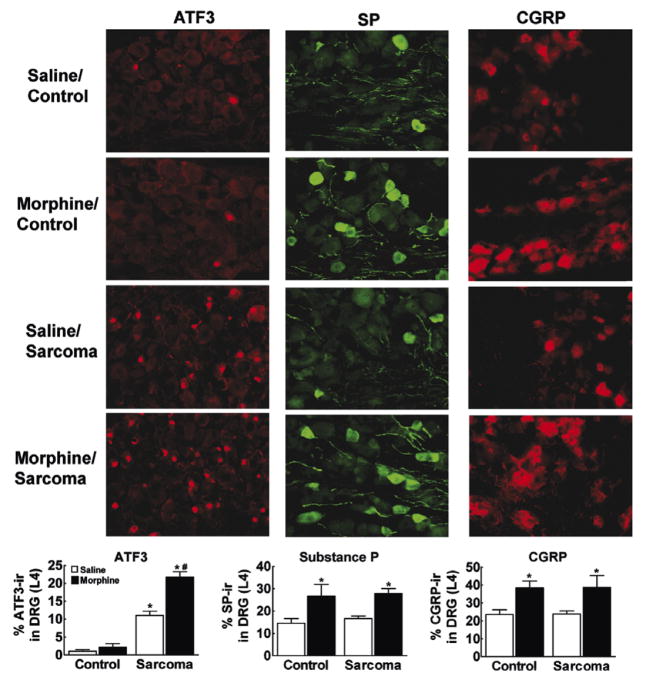
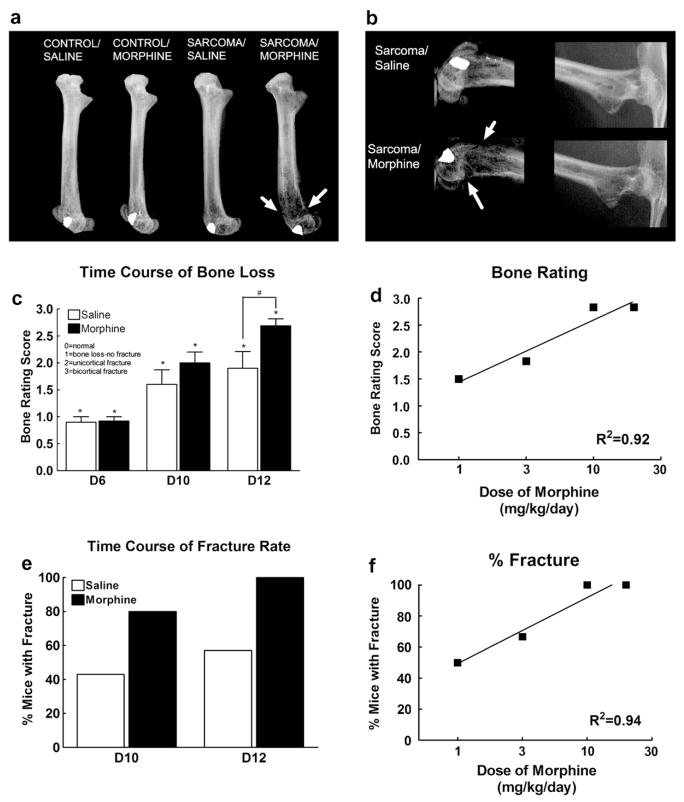
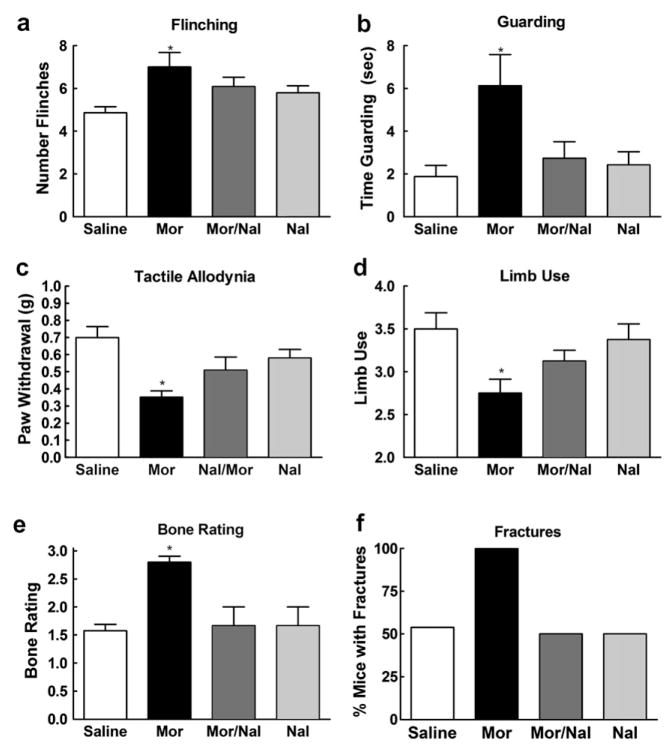
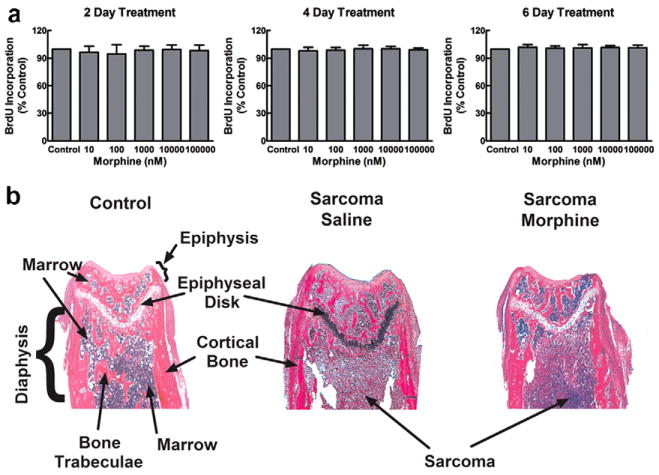
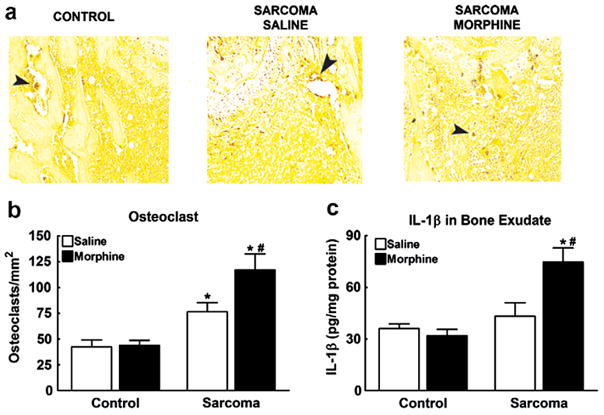
Metastatic bone cancer causes severe pain that is primarily treated with opioids. A model of bone cancer pain in which the progression of cancer pain and bone destruction is tightly controlled was used to evaluate the effects of sustained morphine treatment. In cancer-treated mice, morphine enhanced, rather than diminished, spontaneous, and evoked pain; these effects were dose-dependent and naloxone-sensitive. SP and CGRP positive DRG cells did not differ between sarcoma or control mice, but were increased following morphine in both groups. Morphine increased ATF-3 expression only in DRG cells of sarcoma mice. Morphine did not alter tumor growth in vitro or tumor burden in vivo but accelerated sarcoma-induced bone destruction and doubled the incidence of spontaneous fracture in a dose- and naloxone-sensitive manner. Morphine increased osteoclast activity and upregulated IL-1 beta within the femurs of sarcoma-treated mice suggesting enhancement of sarcoma-induced osteolysis. These results indicate that sustained morphine increases pain, osteolysis, bone loss, and spontaneous fracture, as well as markers of neuronal damage in DRG cells and expression of pro-inflammatory cytokines. Morphine treatment may result in "add-on" mechanisms of pain beyond those engaged by sarcoma alone. While it is not known whether the present findings in this model of osteolytic sarcoma will generalize to other cancers or opioids, the data suggest a need for increased understanding of neurobiological consequences of prolonged opioid exposure which may allow improvements in the use of opiates in the effective management of cancer pain.


Figures

Fig. 1
Fig. 1
Sarcoma cells (sarcoma) or control media (control) were injected into the intramedullary space of the femur and behavior was tested beginning 6 days later. Saline or morphine osmotic minipumps were implanted 7 days after sarcoma/media injection and were tested 10 and 12 days after injection (3 and 5 days after minipump implantation). (a) Sarcoma-treated mice with morphine infusion showed increased flinching compared to all other treatment groups on test days 10 and 12. (b) All sarcoma-treated mice showed increased guarding behavior compared to control-treated mice. Sarcoma-treated mice with morphine infusion showed more guarding behavior compared to sarcoma-treated mice with saline infusion. (c) Mice injected with control media receiving morphine infusion demonstrated lower paw withdrawal thresholds on test days 10 and 12 (3 and 5 days into morphine infusion) indicating tactile hypersensitivity. All sarcoma-treated mice showed lower paw withdrawal thresholds on test days 10 and 12, with mice receiving morphine infusions showing lower paw withdrawal thresholds compared to sarcoma-treated mice with saline infusions. (d) Sarcomatreated mice showed limping behaviors (score of 3), with sarcoma-treated mice with morphine infusion developing limping behaviors prior to saline-infused mice (days 10 vs. 12, respectively). All graphs show means ± SEM. *Indicates significant difference from control saline group, #indicates significant difference between saline- and morphine-treated mice within the sarcoma or the control groups.
Fig. 2
Fig. 2
Sarcoma cells were injected into the intramedullary space of the femur. Saline or morphine osmotic minipumps delivering morphine sulfate at 1, 3, 10, or 20 mg/kg/days were implanted (s.c.) 7 days after injection and were tested 12 days after injection (5 days after pump implantation). (a) Sarcoma-treated mice with morphine infusion showed increased flinching in a dose-dependent manner. (b) Sarcoma-treated mice with morphine infusion showed increased guarding behavior in a dose-dependent manner. (c) Sarcoma-treated mice with morphine infusion showed increased tactile hypersensitivity in a dose-dependent manner. (d) Sarcoma-treated mice with morphine infusion showed decreased limb use. All graphs show means ± SEM with linear regression lines. For all analyses, the slopes of the regression lines were significantly different from zero. Separate groups of six mice were used for each data point.
Fig. 3
Fig. 3
Immunofluorescent staining for ATF3, SP, or CGRP within the ipsilateral DRG (L4) on day 12. Graphs indicate % total DRG cells that are ATF3-ir, SP-ir, or CGRP-ir positive. Mice injected with control media show very low levels of ATF3-ir, with less than 5% ATF3-ir positive cell bodies within the DRG, irrespective of saline or morphine infusion. Sarcoma treatment produced a significant increase in ATF3-ir positive cells, with morphine infusion doubling the percentage of ATF3-ir positive cell bodies. Morphine infusion approximately doubles the percentage of SP-ir positive cell bodies compared to saline-treated mice equally sarcoma and control media-treated mice. Sarcoma treatment did not increase the percentage of SP-ir positive cell bodies compared to control media treatment. Morphine treatment approximately doubles the percentage of CGRP-ir positive cell bodies equally in sarcoma and control media-treated mice, and sarcoma treatment does not increase the percentage of CGRPP-ir positive cell bodies compared to control media treatment. Graphs show means ± SEM. *Indicates significant difference from control saline group, #indicates significant difference between saline- and morphine-treated mice within the sarcoma or the control groups.
Fig. 4
Fig. 4
(a) Radiograph images of the injected femur on day 12. Sarcoma-induced bone loss is greatest at the distal end of the femur, progressing along the femur to the proximal head of the femur. Sarcoma-induced bone loss is more extensive in mice that received morphine infusion across 5 days compared to saline-treated mice. Fractures, indicated by arrows, were defined as full-thickness cortical loss. (b) Enlarged radiograph images of the distal and proximal ends of the femur showing sustained morphine infusion across 5 days increases sarcoma-induced bone loss and increases fractures (indicated by arrows). (c) Bone loss ratings of sarcoma-treated mice with saline or morphine infusions 6, 10, and 12 days following sarcoma injection show that some sarcoma-induced bone loss is observed 6 days following, with no difference between morphine- and saline-treated mice. Unicortical fractures begin to develop 10 days following sarcoma injection. Mice receiving morphine infusion across 5 days demonstrated more sarcoma-induced bone destruction on day 12 compared with saline-treated mice, with more mice showing bicortical fractures. Graphs show means ± SEM. *Indicates significant difference from control saline group. #Indicates significant difference between saline- and morphine-treated mice within the sarcoma or the control groups. (d) Sustained morphine enhanced sarcoma-induced bone loss in a dose-dependent manner. Graphs shows mean ± SEM with linear regression lines. The slope of the regression line was significantly non-zero. Separate groups of six mice were used for each data point. (e) Morphine infusion doubled the percentage of mice with sarcoma-induced spontaneous fractures compared to saline-infused animals. (f) Morphine infusion increased the incidence of sarcoma-induced spontaneous fractures in a dose-dependent manner. Graphs shows means ± SEM with linear regression lines. The slope of the regression line was significantly non-zero. Separate groups of six mice were used for each data point.
Fig. 5
Fig. 5
Sarcoma cells were injected into the intramedullary space of the femur. Naloxone (10 mg/kg/day, s.c.) was administered alone and in parallel, through separate minipumps, with the highest dose of morphine (20 mg/kg/day, s.c.). Minipumps were implanted (s.c.) 7 days after injection and were tested 12 days after injection (5 days after pump implantation). (a) Administration of naloxone with morphine prevented the sustained morphine-induced increase in sarcoma-induced flinching. (b) Administration of naloxone with morphine prevented the sustained morphine-induced increase in sarcoma-induced guarding. (c) Administration of naloxone with morphine prevented the sustained morphine-induced increase in tactile hypersensitivity. (d) Administration of naloxone with morphine prevented sustained morphine-induced increase in limping behavior. (e) Administration of naloxone with morphine prevented sustained morphine-induced increase in bone loss. (f) Administration of naloxone with morphine prevented the doubling in the incidence of spontaneous fracture. Naloxone alone had no effect on sarcoma-induced behaviors. Graphs (a–e) represent means ± SEM. *Indicates significant difference from control saline group.
Fig. 6
Fig. 6
(a) Sarcoma cell growth was assessed in vitro by measuring BrdU incorporated into the sarcoma cells by ELISA. Sarcoma cells were untreated (control), or treated with various doses of morphine for 2, 4, or 6 days prior to assay. All assays were carried out in 96-well plates. Morphine treatment was timed such that the designated treatment period ended 4 days after plating, when the cells reached 50–70% confluency in the culture wells. The optical density at 450 nm in the morphine-treated samples is expressed as % of that in the untreated control cells done in parallel, and data are means ± SEM from three independent experiments. Morphine had no effect on the BrdU immunoreactivity incorporated into the cultured cells compared to control cells that were not treated with morphine. (b) Femur sections were stained with hematoxylin and eosin (H&E) on day 10. The distal ends of femurs from control mice show normal bone marrow, trabecular bone and cortical bone. The distal ends of sarcoma-treated femurs show tumor cells throughout the metaphysis of the distal head of the femur in both the saline- and morphine-treated mice.
Fig. 7
Fig. 7
(a) Femur sections were stained with tartrate-resistant acid phosphatase (TRAP) on day 10 to visualize osteoclasts that stained dark red (indicated by arrows). Osteoclast staining was increased in sarcoma-treated mice compared to control mice. (b) Sarcoma increased the number of osteoclasts within the metaphysis of the femur. Morphine infusion further increased osteoclasts compared to saline-infused mice. Osteoclast counts did not differ between morphine- and saline-infused mice treated with control media. (c) IL-1β protein content was measured in exudate from the intramedullary space of the femurs on day 12. Sustained morphine infusion increased IL-1β protein content in sarcoma-treated mice. Sustained morphine infusion had no effect on IL-1β protein levels in control media-treated mice. Graphs show means ± SEM. *Indicates significant difference from control saline group, #indicates significant difference between saline- and morphine-treated mice within the sarcoma or the control groups.

Comment in

References

    1. Allan L, Hays H, Jensen N-H, de Waroux BLP, Bolt M, Donald R, et al. Randomised crossover trial of transdermal fentanyl and sustained release oral morphine for treating chronic non-cancer pain. BMJ. 2001;322:1154–60. - PMC - PubMed
    1. Baamonde A, Lastra A, Juarez L, Garcia V, Hidalgo A, Menendez L. Effects of the local administration of selective mu-, delta- and kappa-opioid receptor agonists on osteosarcoma-induced hyperalgesia. Naunyn Schmiedebergs Arch Pharmacol. 2005;372:213–9. - PubMed
    1. Beeton CA, Bord S, Ireland D, Compston JE. Osteoclast formation and bone resorption are inhibited by megakaryocytes. Bone. 2006;39:985–90. - PubMed
    1. Blair HC, Robinson LJ, Zaidi M. Osteoclast signalling pathways. Biochem Biophys Res Commun. 2005;328:728–38. - PubMed
    1. Blum RH, Novetsky D, Shasha D, Fleishman S. The multidisciplinary approach to bone metastases. Oncology (Huntington) 2003;17:845–57. discussion 862–3, p. 867. - PubMed

Publication types

MeSH terms