. 2007 Oct 15;38(1):34-42.
doi: 10.1016/j.neuroimage.2007.06.032. Epub 2007 Jul 18.

A novel approach for imaging brain-behavior relationships in mice reveals unexpected metabolic patterns during seizures in the absence of tissue plasminogen activator

Affiliations

A novel approach for imaging brain-behavior relationships in mice reveals unexpected metabolic patterns during seizures in the absence of tissue plasminogen activator

Martine M Mirrione et al. Neuroimage. .

Abstract

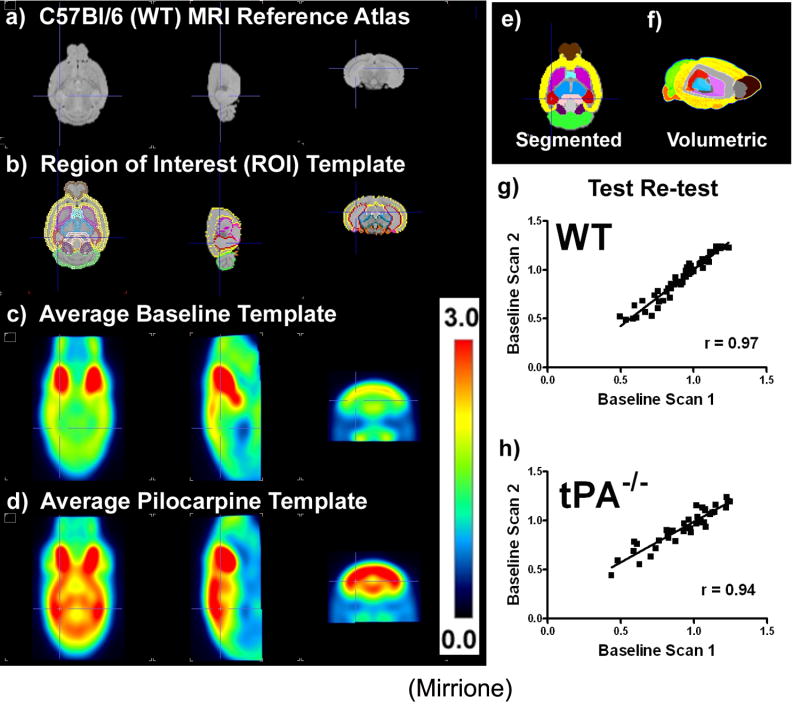
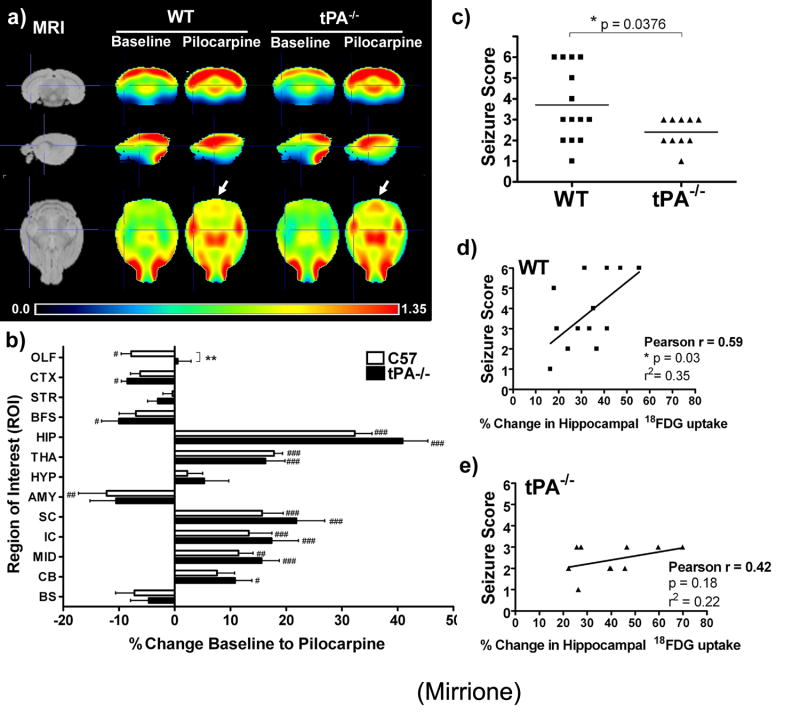
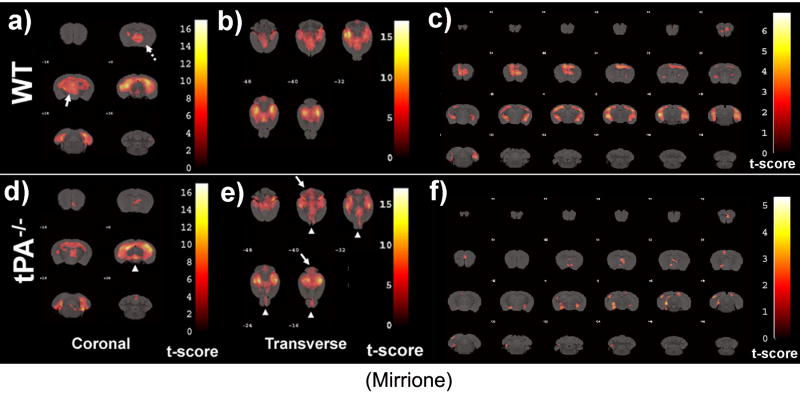
Medically refractory seizures cause inflammation and neurodegeneration. Seizure initiation thresholds have been linked in mice to the serine protease tissue plasminogen activator (tPA); mice lacking tPA exhibit resistance to seizure induction, and the ensuing inflammation and neurodegeneration are similarly suppressed. Seizure foci in humans can be examined using PET employing 2-deoxy-2[(18)F]fluoro-d-glucose ((18)FDG) as a tracer to visualize metabolic dysfunction. However, there currently exist no such methods in mice to correlate measures of brain activation with behavior. Using a novel method for small animal PET data analysis, we examine patterns of (18)FDG uptake in wild-type and tPA(-/-) mice and find that they correlate with the severity of drug-induced seizure initiation. Furthermore, we report unexpected activations that may underlie the tPA modulation of seizure susceptibility. The methods described here should be applicable to other mouse models of human neurological disease.


Figures

Figure 1
Figure 1. Templates for mouse brain data analysis and validation of longitudinal design
a) C57Bl/6J (wt) mouse MRI reference atlas(Ma et al., 2005) (left to right views, transverse, sagital, coronal). b) Region of interest (ROI) template shown overlaid on the atlas, c) ROIs shown filled in and color coded on transverse plane, (brown = olfactory bulb, yellow = neocortex, red = hippocampus, purple = striatum, light blue = basal forebrain and septum, pink = amygdale, black = hypothalamus, light green = cerebellum, dark green = midbrain, dark purple = inferior colliculi, peach = superior colliculi, brain stem = orange). d) volumetric (3D) display of template regions with a cut out into the brain revealing the striatum in purple, thalamus in blue, and hippocampus in red, e) 18FDG baseline template and f) pilocarpine treatment template. g) Ratio to whole brain ROI statistics calculated for each individual animal’s baseline scan (scan 1) correlated with the second baseline scan (scan 2) one week later for wt (a, r2=0.9427, slope=1.154±0.04024, p<0.0001, n=4) and, h) tPA-/- (b, r2 = 0.8848, slope=0.8312 ±0.04930, p<0.0001, n=3) shown to be significant by a Pearson coefficient & regression analysis with runs test for departure from linearity.
Figure 2
Figure 2. Average regional 18FDG uptake before and after acute seizures
a) Individual spatially pre-processed images were skull stripped, globally normalized, and averaged together to create a representative brain radioactivity distribution map for each group (wt n=14, tPA-/- n=11) and shown in reference to the MRI template (top row: coronal, middle: sagittal, and bottom: transverse views). Relative ratio to whole brain intensity patterns are shown which demonstrate regional activations in the hippocampus and thalamus for both genotypes following pilocarpine administration and acute seizures. Arrows display an area of increased 18FDG uptake in tPA-/- mice following seizures which was less apparent in the wt average image. Crosshairs are located at the hippocampus in all views. b) Percent change in 18FDG uptake between baseline and seizure scan show significant increases in the hippocampus and thalamus for both genotypes, while tPA-/- mice show more significant activations in the midbrain and cerebellum when comparing baseline and post challenge scans. The percent change in 18FDG uptake before and after seizures were significantly different between genotypes in the olfactory bulb. (Olfactory bulb (OLF), striatum (STR), basal forebrain and septum (BFS), cortex (CTX), hippocampus (HIP), thalamus (THA), hypothalamus (HYP), amygdale (AMY), cerebellum (CB), brain stem (BS), superior colliculi (SC), rest of mid brain (MID), and inferior colliculi (IC). (# = p<0.05, ## = p < 0.01, ### = p<0.001, two-way ANOVA with repeated measures and Bonferroni post-tests comparing baseline to pilocarpine average ROI values for each genotype, factor treatment & ROI; ** = p<0.01 Student’s t-test comparing wt versus tPA-/- percent change for each region.). c) Behavioural analysis comparing seizure symptoms in wild type and tPA-/- mice show a significant difference in the distribution of seizure scores assigned to each animal based on symptoms during 18FDG uptake (p=0.0376, two-tailed, unpaired t-test). d,e) Seizure scores correlated with percent change in hippocampal 18FDG uptake baseline to post seizures. Note: in b, two points overlap (seizure score 2 and two animals showed a 24% change) and in c) two points overlap (seizure score 2 and 39% change). Also note, behavioural data for one tPA-/- animal were accidentally not collected, and thus are not included in this analysis (wt n=14, tPA-/- n=10).
Figure 3
Figure 3. Voxel based analysis for neuronal activation caused by seizures
MRI reference template was overlaid with activations caused by seizures in wild type-mice (a-c) and tPA-/- mice (d-f). For wt mice, areas of increased activation compared to tPA-/- include septum (a, dotted arrow) and thalamus (a, arrow). For tPA-/- mice, areas of unexpected increased activation compared to wt mice include the midbrain (d, arrow head), cerebellum (e, arrows) and olfactory bulb (e, arrow heads). Thresholds for displayed images were set at P < 0.001 for coronal and P < 0.01 for transverse views in order to effectively reveal differences between genotypes. SPM covariate analysis to elucidate voxels where 18FDG increased as a function of seizure severity in wt (c) and tPA-/- (f) mice. Voxels represent regions that increase in 18FDG with seizure severity. The statistical threshold (t or p value) was set at p<0.05 with an extent threshold of 100 contiguous voxels. T-scores are represented by the color scale shown.

References

    1. Abbey CK, Borowsky AD, McGoldrick ET, Gregg JP, Maglione JE, Cardiff RD, Cherry SR. In vivo positron-emission tomography imaging of progression and transformation in a mouse model of mammary neoplasia. Proc Natl Acad Sci U S A. 2004;101:11438–11443. - PMC - PubMed
    1. Alexoff DL, Vaska P, Marsteller D, Gerasimov T, Li J, Logan J, Fowler JS, Taintor NB, Thanos PK, Volkow ND. Reproducibility of 11C-raclopride binding in the rat brain measured with the microPET R4: effects of scatter correction and tracer specific activity. J Nucl Med. 2003;44:815–822. - PubMed
    1. Baranes D, Lederfein D, Huang YY, Chen M, Bailey CH, Kandel ER. Tissue plasminogen activator contributes to the late phase of LTP and to synaptic growth in the hippocampal mossy fiber pathway. Neuron. 1998;21:813–825. - PubMed
    1. Carne RP, O’Brien TJ, Kilpatrick CJ, MacGregor LR, Hicks RJ, Murphy MA, Bowden SC, Kaye AH, Cook MJ. MRI-negative PET-positive temporal lobe epilepsy: a distinct surgically remediable syndrome. Brain. 2004;127:2276–2285. - PubMed
    1. Carroll PM, Tsirka SE, Richards WG, Frohman MA, Strickland S. The mouse tissue plasminogen activator gene 5’ flanking region directs appropriate expression in development and a seizure-enhanced response in the CNS. Development. 1994;120:3173–3183. - PubMed

Publication types

MeSH terms

Substances