

Evaluating and learning from RNA pseudotorsional space: quantitative validation of a reduced representation for RNA structure
- PMID: 17707400
- PMCID: PMC2720064
- DOI: 10.1016/j.jmb.2007.06.058
Evaluating and learning from RNA pseudotorsional space: quantitative validation of a reduced representation for RNA structure
Abstract
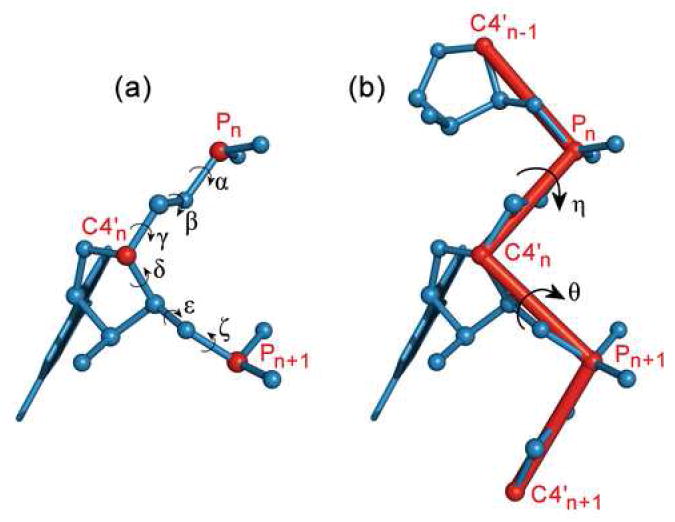
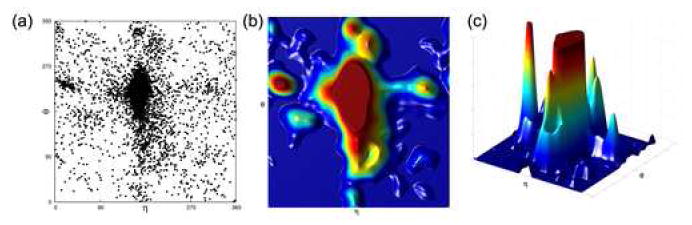
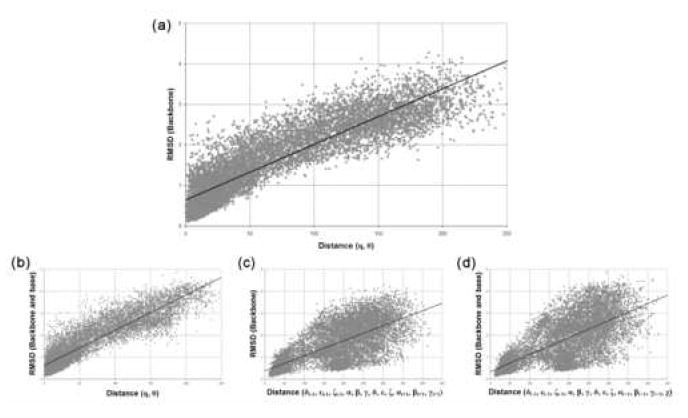
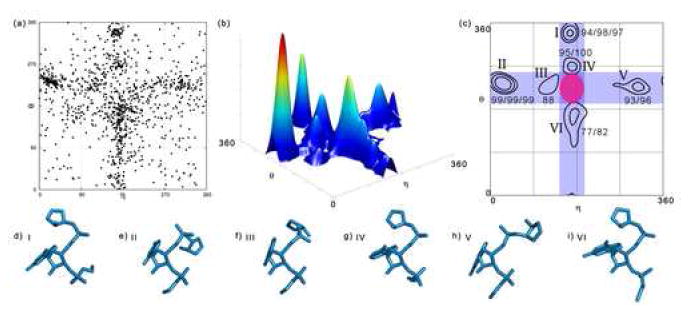
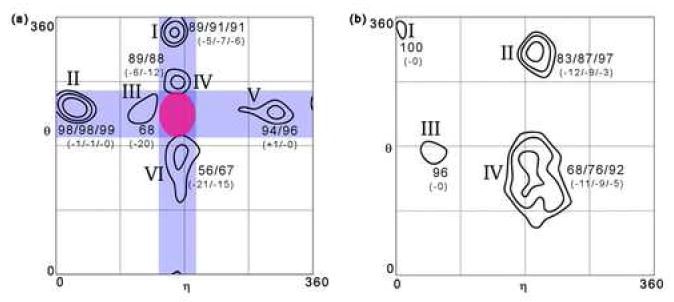
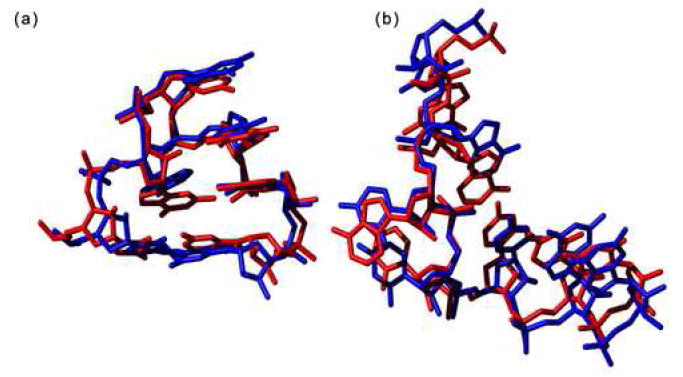
Quantitatively describing RNA structure and conformational elements remains a formidable problem. Seven standard torsion angles and the sugar pucker are necessary to characterize the conformation of an RNA nucleotide completely. Progress has been made toward understanding the discrete nature of RNA structure, but classifying simple and ubiquitous structural elements such as helices and motifs remains a difficult task. One approach for describing RNA structure in a simple, mathematically consistent, and computationally accessible manner involves the invocation of two pseudotorsions, eta (C4'(n-1), P(n), C4'(n), P(n+1)) and theta (P(n), C4'(n), P(n+1), C4'(n+1)), which can be used to describe RNA conformation in much the same way that varphi and psi are used to describe backbone configuration of proteins. Here, we conduct an exploration and statistical evaluation of pseudotorsional space and of the Ramachandran-like eta-theta plot. We show that, through the rigorous quantitative analysis of the eta-theta plot, the pseudotorsional descriptors eta and theta, together with sugar pucker, are sufficient to describe RNA backbone conformation fully in most cases. These descriptors are also shown to contain considerable information about nucleotide base conformation, revealing a previously uncharacterized interplay between backbone and base orientation. A window function analysis is used to discern statistically relevant regions of density in the eta-theta scatter plot and then nucleotides in colocalized clusters in the eta-theta plane are shown to have similar 3-D structures through RMSD analysis of the RNA structural constituents. We find that major clusters in the eta-theta plot are few, underscoring the discrete nature of RNA backbone conformation. Like the Ramachandran plot, the eta-theta plot is a valuable system for conceptualizing biomolecular conformation, it is a useful tool for analyzing RNA tertiary structures, and it is a vital component of new approaches for solving the 3-D structures of large RNA molecules and RNA assemblies.
Figures

Similar articles
-
Stepping through an RNA structure: A novel approach to conformational analysis.J Mol Biol. 1998 Dec 18;284(5):1465-78. doi: 10.1006/jmbi.1998.2233. J Mol Biol. 1998. PMID: 9878364
-
A new way to see RNA.Q Rev Biophys. 2011 Nov;44(4):433-66. doi: 10.1017/S0033583511000059. Epub 2011 May 18. Q Rev Biophys. 2011. PMID: 21729350 Free PMC article.
-
The pseudotorsional space of RNA.RNA. 2023 Dec;29(12):1896-1909. doi: 10.1261/rna.079821.123. Epub 2023 Oct 4. RNA. 2023. PMID: 37793790 Free PMC article.
-
Structures of helical junctions in nucleic acids.Q Rev Biophys. 2000 May;33(2):109-59. doi: 10.1017/s0033583500003590. Q Rev Biophys. 2000. PMID: 11131562 Review.
-
Folic acid supplementation and malaria susceptibility and severity among people taking antifolate antimalarial drugs in endemic areas.Cochrane Database Syst Rev. 2022 Feb 1;2(2022):CD014217. doi: 10.1002/14651858.CD014217. Cochrane Database Syst Rev. 2022. PMID: 36321557 Free PMC article.
Cited by
-
iPARTS2: an improved tool for pairwise alignment of RNA tertiary structures, version 2.Nucleic Acids Res. 2016 Jul 8;44(W1):W328-32. doi: 10.1093/nar/gkw412. Epub 2016 May 16. Nucleic Acids Res. 2016. PMID: 27185896 Free PMC article.
-
Visualizing the ai5γ group IIB intron.Nucleic Acids Res. 2014 Feb;42(3):1947-58. doi: 10.1093/nar/gkt1051. Epub 2013 Nov 6. Nucleic Acids Res. 2014. PMID: 24203709 Free PMC article.
-
Predicting loop-helix tertiary structural contacts in RNA pseudoknots.RNA. 2010 Mar;16(3):538-52. doi: 10.1261/rna.1800210. Epub 2010 Jan 25. RNA. 2010. PMID: 20100813 Free PMC article.
-
Lightweight object oriented structure analysis: tools for building tools to analyze molecular dynamics simulations.J Comput Chem. 2014 Dec 15;35(32):2305-18. doi: 10.1002/jcc.23753. Epub 2014 Oct 18. J Comput Chem. 2014. PMID: 25327784 Free PMC article.
-
Has AlphaFold3 achieved success for RNA?Acta Crystallogr D Struct Biol. 2025 Feb 1;81(Pt 2):49-62. doi: 10.1107/S2059798325000592. Epub 2025 Jan 27. Acta Crystallogr D Struct Biol. 2025. PMID: 39868559 Free PMC article.
References
-
- Holbrook SR, Sussman JL, Warrant RW, Kim SH. Crystal structure of yeast phenylalanine transfer RNA. II. Structural features and functional implications. J Mol Biol. 1978;123:631–60. - PubMed
Publication types
MeSH terms
Substances
Grants and funding
LinkOut - more resources
Full Text Sources
Other Literature Sources
Miscellaneous
