

Atypical neural substrates of Embedded Figures Task performance in children with Autism Spectrum Disorder
- PMID: 17707658
- PMCID: PMC2084060
- DOI: 10.1016/j.neuroimage.2007.07.013
Atypical neural substrates of Embedded Figures Task performance in children with Autism Spectrum Disorder
Abstract
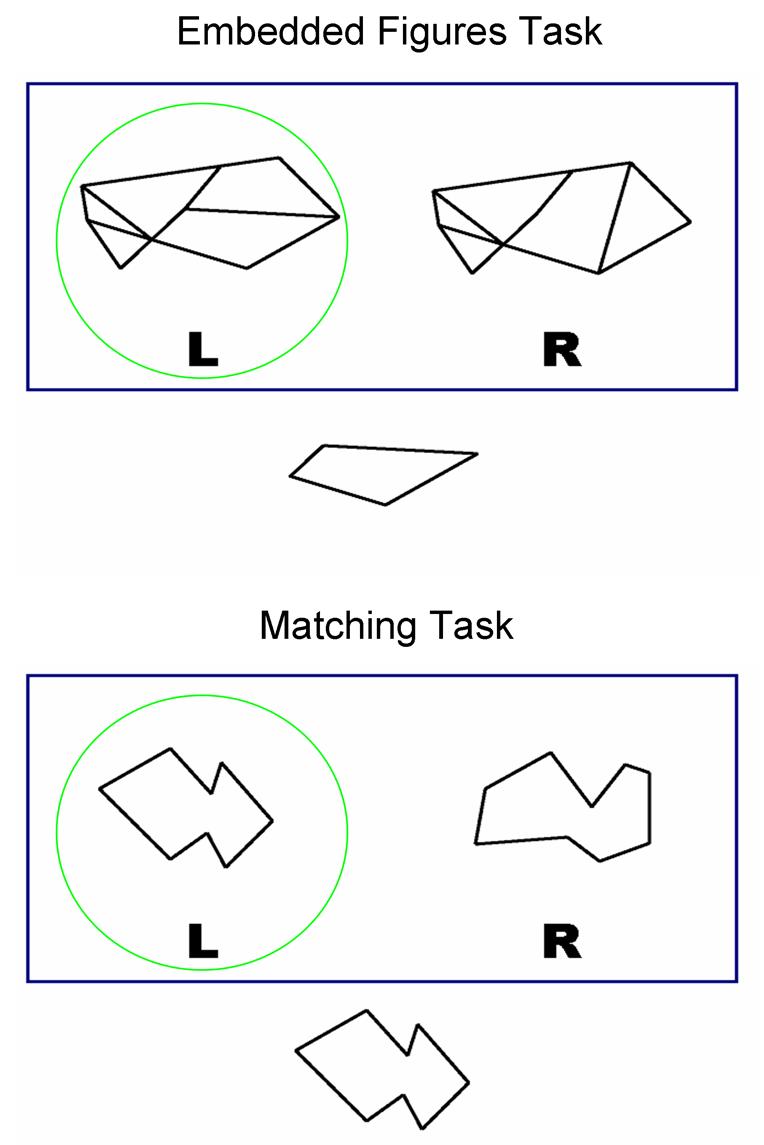
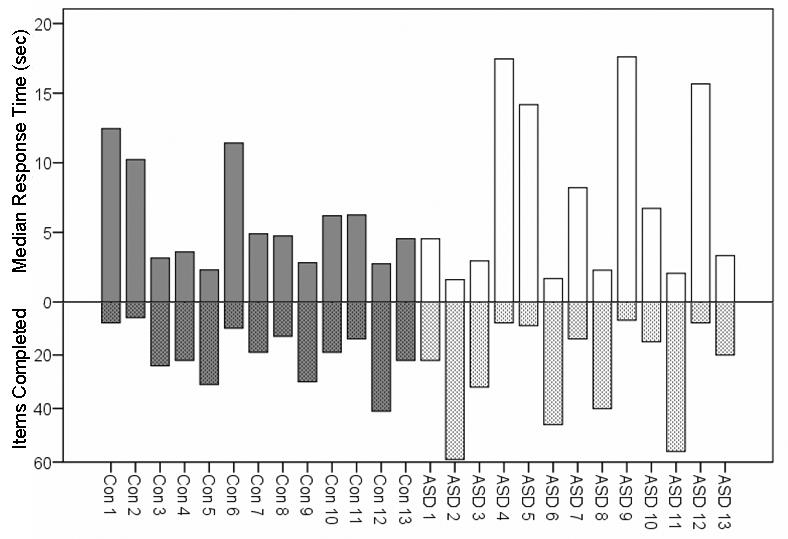
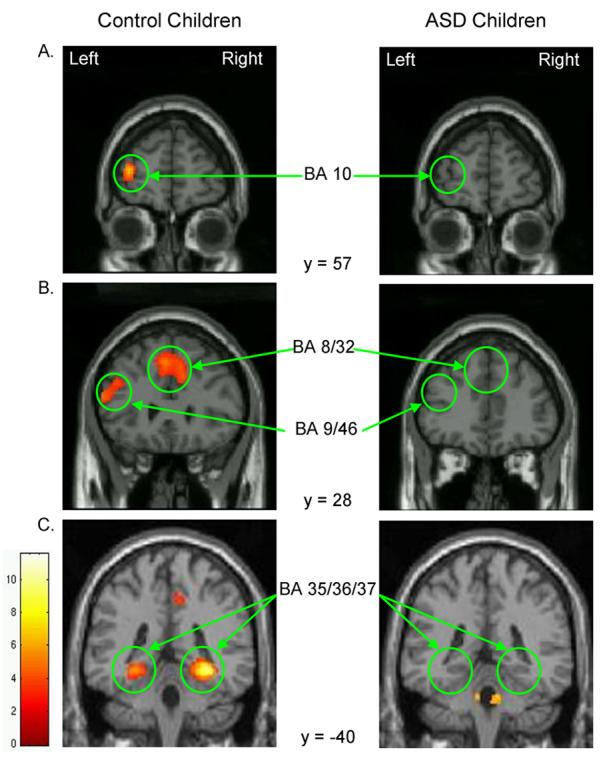
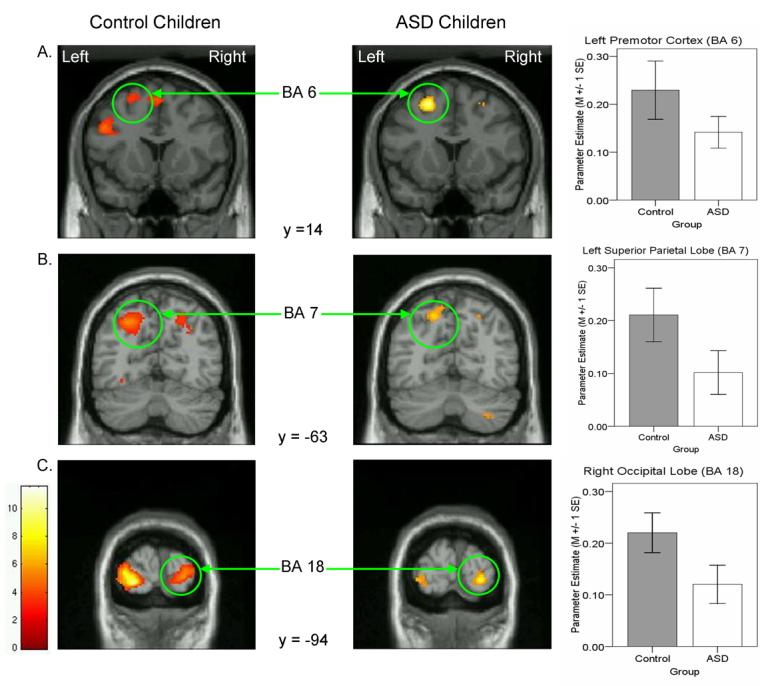
Superior performance on the Embedded Figures Task (EFT) has been attributed to weak central coherence in perceptual processing in Autism Spectrum Disorder (ASD). The present study used functional magnetic resonance imaging to examine the neural basis of EFT performance in 7- to 12-year-old ASD children and age- and IQ-matched controls. ASD children activated only a subset of the distributed network of regions activated in controls. In frontal cortex, control children activated left dorsolateral, medial and dorsal premotor regions whereas ASD children only activated the dorsal premotor region. In parietal and occipital cortices, activation was bilateral in control children but unilateral (left superior parietal and right occipital) in ASD children. Further, extensive bilateral ventral temporal activation was observed in control, but not ASD children. ASD children performed the EFT at the same level as controls but with reduced cortical involvement, suggesting that disembedded visual processing is accomplished parsimoniously by ASD relative to typically developing brains.
Figures
References
-
- A. P. A. Diagnostic and statistical manual for mental disorders. 4th edition. American Psychiatric Association; Washington, DC: 2000. text revision.
-
- Belmonte MK, Yurgelun-Todd DA. Functional anatomy of impaired selective attention and compensatory processing in autism. Brain Res Cogn Brain Res. 2003;17(3):651–664. - PubMed
-
- Berl MM, Vaidya CJ, Gaillard WD. Functional imaging of developmental and adaptive changes in neurocognition. Neuroimage. 2006;30(3):679–691. - PubMed
-
- Blanca MJ, Zalabardo C, Garcia-Criado F, Siles R. Hemispheric differences in global and local processing dependent on exposure duration. Neuropsychologia. 1994;32(11):1343–1351. - PubMed
-
- Brett M, Anton J, Valabregue R, Poline J. Region of interest analysis using an SPM toolbox (abstract) Neuroimage. 2003;16(Supplemental) (CD-ROM)
Publication types
MeSH terms
Grants and funding
LinkOut - more resources
Full Text Sources
