. 2007 Aug;3(8):e161.
doi: 10.1371/journal.pcbi.0030161. Epub 2007 Jun 29.

Elucidating the altered transcriptional programs in breast cancer using independent component analysis

Affiliations

Elucidating the altered transcriptional programs in breast cancer using independent component analysis

Andrew E Teschendorff et al. PLoS Comput Biol. 2007 Aug.

Abstract

The quantity of mRNA transcripts in a cell is determined by a complex interplay of cooperative and counteracting biological processes. Independent Component Analysis (ICA) is one of a few number of unsupervised algorithms that have been applied to microarray gene expression data in an attempt to understand phenotype differences in terms of changes in the activation/inhibition patterns of biological pathways. While the ICA model has been shown to outperform other linear representations of the data such as Principal Components Analysis (PCA), a validation using explicit pathway and regulatory element information has not yet been performed. We apply a range of popular ICA algorithms to six of the largest microarray cancer datasets and use pathway-knowledge and regulatory-element databases for validation. We show that ICA outperforms PCA and clustering-based methods in that ICA components map closer to known cancer-related pathways, regulatory modules, and cancer phenotypes. Furthermore, we identify cancer signalling and oncogenic pathways and regulatory modules that play a prominent role in breast cancer and relate the differential activation patterns of these to breast cancer phenotypes. Importantly, we find novel associations linking immune response and epithelial-mesenchymal transition pathways with estrogen receptor status and histological grade, respectively. In addition, we find associations linking the activity levels of biological pathways and transcription factors (NF1 and NFAT) with clinical outcome in breast cancer. ICA provides a framework for a more biologically relevant interpretation of genomewide transcriptomic data. Adopting ICA as the analysis tool of choice will help understand the phenotype-pathway relationship and thus help elucidate the molecular taxonomy of heterogeneous cancers and of other complex genetic diseases.


Conflict of interest statement

Competing interests. The authors have declared that no competing interests exist.

Figures

Figure 1
Figure 1. The ICA Model of Gene Expression
Schematic depiction of the ICA model for gene expression. (A) Measured gene expression variations are caused by alterations in the activation levels of biological pathways. In the ICA model, the gene expression matrix is decomposed into the product of a “source” matrix S and a “mixing” matrix A, where K is the number of inferred independent components (IC) to which pathways and regulatory modules map. The columns of S describe the activation levels of genes in the various inferred independent components, while the rows of A give the activation levels of the independent components across tumor samples. The product of S and A can be written as a sum over the IC submatrices IC-1,IC-2,...IC-K. (B) ICk–submatrix is obtained by multiplying the k-th column of S, Sk, with the k-th row of A, Ak. The genes with the largest absolute weights in Sk are selected and tested for enrichment of biological pathways, while the distribution of weights in Ak are tested for discriminatory power of phenotypes. (Colour codes for heatmaps: red, overexpression; green, underexpression; blue, upregulation; yellow, downregulation.)
Figure 2
Figure 2. Testing the ICA Paradigm
(A) For each cohort and method, we give the pathway enrichment index, PEI, defined by the fraction of biological pathways (536 in total) found enriched in at least one component. (B) For each cohort and method, we give the fraction of cancer-signalling and oncogenic pathways (14 in total) successfully mapped by the inferred components. (C) For each cohort and method, we give the fraction of motif-regulatory gene sets (173 in total) captured by the inferred components.
Figure 3
Figure 3. Most Consistent and Frequently Mapped Pathways and Regulatory Motifs
(A) For each method, we compare the number of pathways that were consistently mapped to components across the four major breast cancer studies. (B) Twenty of the most frequently mapped pathways by ICA. The scores give the average number of ICA components in which the pathway was mapped. (C) For each method, we give the number of motif-regulatory gene sets consistently mapped to components across the four major breast cancer cohorts. (D) The 20 most frequently mapped transcription factors/regulatory motifs by ICA. The scores give the average number of ICA components in which the regulatory module of the motif was mapped.
Figure 4
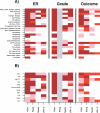
Figure 4. Heatmaps of Association of Pathways and Regulatory Modules with Breast Cancer Phenotypes
For three phenotypes (ER, Grade, Outcome), we show heatmaps of association between phenotypes and selected pathways (A) and selected regulatory motifs (B), as revealed by the four ICA algorithms across the four major breast cancer cohorts. For phenotypes, we used a p-value threshold of 0.05 to establish whether an ICA component was associated with that phenotype. For pathways and regulatory modules, we used the Benjamini corrected p-values as before. For each cohort, we then counted the number of ICA algorithms that found a component linking a phenotype with a pathway/regulatory module, which was colour-coded as 4 (dark red), 3 (red), 2 or 1 (pink), and 0 (white). For Wang's cohort, grade information was unavailable and is colour-coded as grey.
Figure 5
Figure 5. The Association of Immune Response with Estrogen Receptor Status
(A) For each major breast cancer cohort, we give the heatmap of component expression values for the component enriched for the immune-response pathway characterised in [39]. Thus, the heatmap matrix shown is SgkAks where k is the component enriched for the immune response pathway, g is any gene found on the array that is also in the pathway and the selected feature set of the component, and s denotes the tumour sample. Samples have been ordered according to a k-means (k = 2) clustering over the set of genes. The ICA algorithm for which this heatmap is shown is the KernelICA algorithm. Blue denotes “upregulation,” yellow “downregulation.” For the samples, black denotes an ER− and grey an ER + tumour. (B) For each major breast cancer cohort, we give the heatmap of expression values for the same set of genes as in (A). Thus, the heatmap matrix shown is Xgs where Xgs denotes the measured expression level of gene g in sample s. As before, samples have been ordered according to a k-means (k = 2) clustering over the represented genes. Red denotes relative overexpression, green underexpression. Magenta denotes the upregulated cluster, cyan the downregulated cluster.
Figure 6
Figure 6. The Association of Epithelial–Mesenchymal Transition with Histological Grade
(A) For each major breast cancer cohort where grade information was available, we give the heatmap of component expression values for the component enriched for the EMT pathway characterised in [41]. Thus, the heatmap matrix shown is SgkAks where k is the component enriched for the EMT pathway, g is any gene found on the array that is also in the pathway and the selected feature set of the component, and s denotes the tumour sample. The ICA algorithm for which this heatmap is shown is the KernelICA algorithm. Samples have been ordered according to a k-means (k = 2) clustering over the set of genes. Blue denotes “upregulation,” yellow “downregulation.” For the samples, histological grade is colour-coded as black (high-grade), blue (intermediate grade), and skyblue (low-grade). (B) For each major breast cancer cohort, we give the heatmap of expression values for the same set of genes as in (A). Thus, the heatmap matrix shown is Xgs where Xgs denotes the measured expression level of gene g in sample s. As before, samples have been ordered according to a hierarchical clustering over the represented genes. Red denotes relative overexpression, green underexpression. Magenta denotes the upregulated cluster, cyan the downregulated cluster.
Figure 7
Figure 7. Inter-Method Comparison of Selected Associations of Pathways and Regulatory Modules with Breast Cancer Phenotypes
The ability of the various methods to capture novel biological associations between pathways/regulatory modules and phenotypes is represented as a binary heatmap across methods and cohorts. (A) Immune response pathway and ER status, (B) EMT-pathway and grade, (C) IRF and ER status, (D) Neurofibromin-1 and clinical outcome. Black denotes a statistically significant association between a pathway/regulatory module and the phenotype in question, white means no evidence of an association.
Figure 8
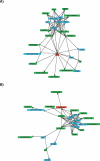
Figure 8. Association Networks
Average association networks shown for ER status (A) and clinical outcome (B). Only edges between phenotypes, pathways, and transcription factors are shown (for the sake of clarity, edges between any two pathways, transcription factors, or phenotypes are not shown). An edge between two nodes was defined if the association between the two nodes was present in at least three out of the four studies, as predicted by the KernelICA algorithm. The diagrams are colour-coded as follows: phenotype (red), pathways (green), and transcription factors/binding motifs (blue). INFLR, inflammatory response; TM, tyrosine metabolism.

References

    1. Pollack JR, Sorlie T, Perou CM, Rees CA, Jeffrey SS, et al. Microarray analysis reveals a major direct role of dna copy number alteration in the transcriptional program of human breast tumors. Proc Natl Acad Sci U S A. 2002;99:12963–12968. - PMC - PubMed
    1. Stransky N, Vallot C, Reyal F, Bernard-Pierrot I, de Medina SG, et al. Regional copy number–independent deregulation of transcription in cancer. Nat Genet. 2006;38:1386–1396. - PubMed
    1. Rhodes DR, Kalyana-Sundaram S, Mahavisno V, Barrette TR, Ghosh D, et al. Mining for regulatory programs in the cancer transcriptome. Nat Genet. 2005;37:579–583. - PubMed
    1. Levine DM, Haynor DR, Castle JC, Stepaniants SB, Pellegrini M, et al. Pathway and gene-set activation measurement from mrna expression data: The tissue distribution of human pathways. Genome Biol. 2006;7:R93. - PMC - PubMed
    1. Ertel A, Verghese A, Byers SW, Ochs M, Tozeren A. Pathway-specific differences between tumor cell lines and normal and tumor tissue cells. Mol Cancer. 2006;5:55. - PMC - PubMed

Publication types

MeSH terms

Substances