. 2007 Aug;3(8):e136.
doi: 10.1371/journal.pgen.0030136. Epub 2007 Jul 2.

Identification and characterization of cell type-specific and ubiquitous chromatin regulatory structures in the human genome

Affiliations

Identification and characterization of cell type-specific and ubiquitous chromatin regulatory structures in the human genome

Hualin Xi et al. PLoS Genet. 2007 Aug.

Abstract

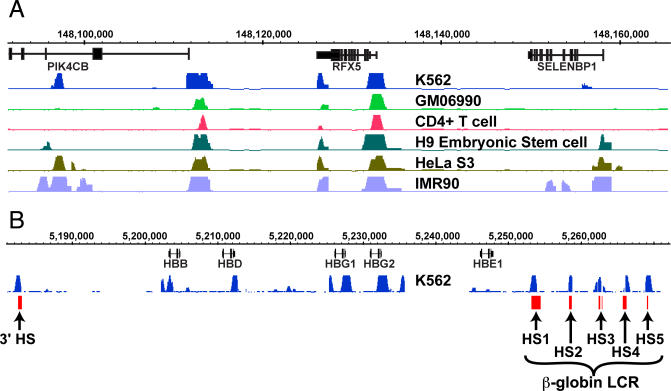
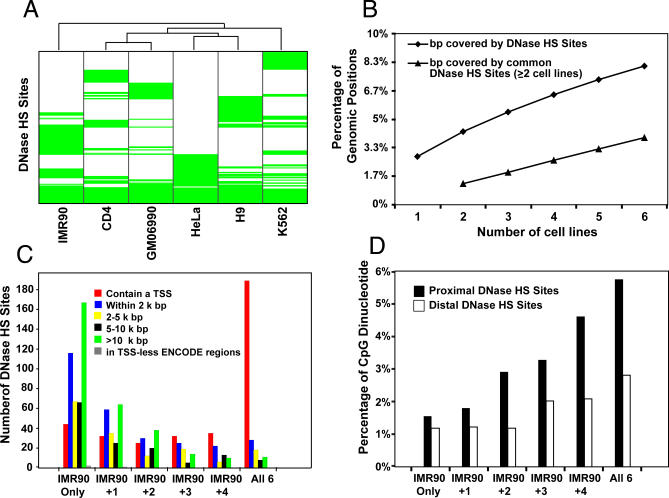
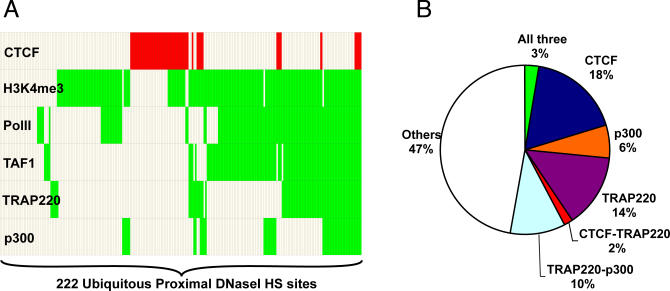
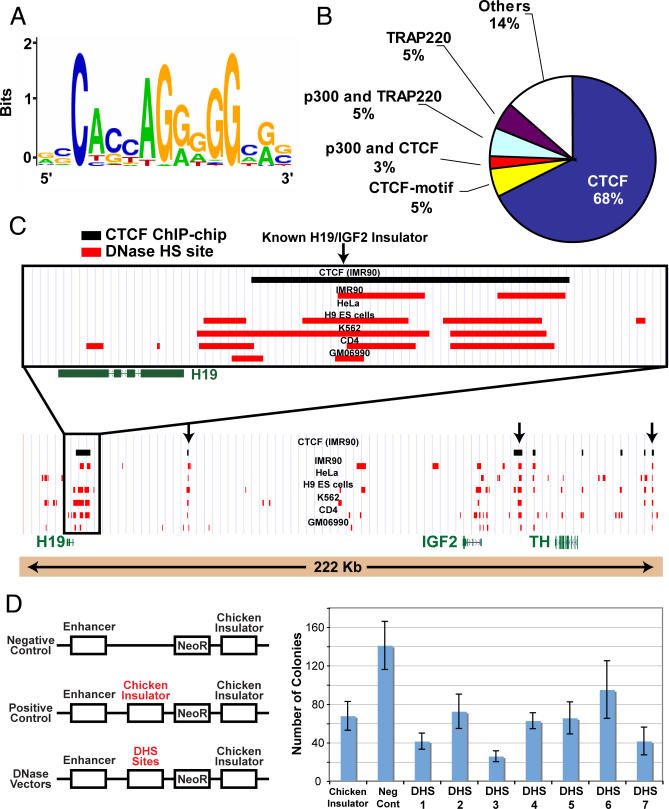
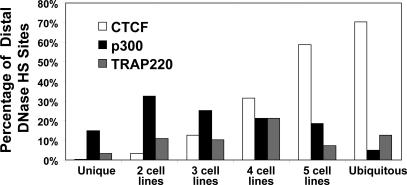
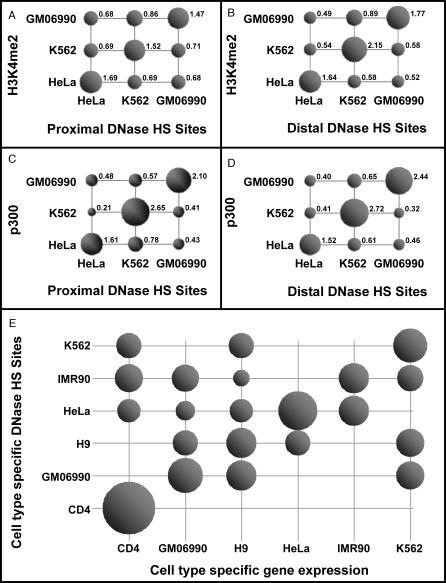
The identification of regulatory elements from different cell types is necessary for understanding the mechanisms controlling cell type-specific and housekeeping gene expression. Mapping DNaseI hypersensitive (HS) sites is an accurate method for identifying the location of functional regulatory elements. We used a high throughput method called DNase-chip to identify 3,904 DNaseI HS sites from six cell types across 1% of the human genome. A significant number (22%) of DNaseI HS sites from each cell type are ubiquitously present among all cell types studied. Surprisingly, nearly all of these ubiquitous DNaseI HS sites correspond to either promoters or insulator elements: 86% of them are located near annotated transcription start sites and 10% are bound by CTCF, a protein with known enhancer-blocking insulator activity. We also identified a large number of DNaseI HS sites that are cell type specific (only present in one cell type); these regions are enriched for enhancer elements and correlate with cell type-specific gene expression as well as cell type-specific histone modifications. Finally, we found that approximately 8% of the genome overlaps a DNaseI HS site in at least one the six cell lines studied, indicating that a significant percentage of the genome is potentially functional.


Conflict of interest statement

Competing interests. The authors have declared that no competing interests exist.

Figures

Figure 1
Figure 1. Identification of DNaseI HS Sites from Six Cell Types
(A) Representative DNase-chip data from ENCODE region ENr231 (Chr1:148050000–148165000). Note that there are common, ubiquitous, and cell type–specific DNaseI HS sites. (B) DNase-chip from K562 cells identifies all five LCR DNaseI HS sites upstream of the β-globin locus, as well as the 3′ DNaseI HS site (in red). There are additional DNaseI HS sites identified around promoter regions of the globin genes.
Figure 2
Figure 2. Identification and Characterization of DNaseI HS Sites
(A) Clustering of six cell lines based on DNaseI HS site profiles. ENCODE regions were divided into 2-kb blocks and a binary DNaseI HS site profile was calculated for each cell line (1 for blocks containing a DNaseI HS sites hit, displayed in green, and 0 otherwise, uncolored). Cell lines were clustered based on their DNaseI HS sites hit profiles using Wards hierarchical clustering [41] with Euclidian distance as the metric. Ubiquitous DNase sites are grouped at the bottom. (B) Cumulative percentage of the genome covered by DNaseI HS sites from increasing number of cell lines. Diamonds represent cumulative percentage of the genome covered by DNaseI HS sites from any cell line. Triangles represent cumulative percentage of the genome overlapped by DNaseI HS sites shared by at least two cell types. Each point is an averaged value of all possible cell line combinations. (C) Location of DNaseI HS sites relative to TSS. DNaseI HS sites from IMR90 cells were first categorized as unique to IMR90, common with other cell types, or ubiquitous in all six cell types. Data centering on other cell types are identical (unpublished data). Distances of each DNaseI HS site were calculated to the nearest TSS. (D) CpG dinucleotide distribution. The percentage of CG dinucleotide was determined for proximal and distal DNaseI HS sites that were unique to IMR90, common with additional cell types, or ubiquitous within all six cell types.
Figure 3
Figure 3. Ubiquitous Proximal DNaseI HS Sites Overlap with Known Factors
(A) Chart identifying the different factors that overlap 222 ubiquitous DNaseI HS sites that map to TSS, including RNA Pol II, TAF1, TRAP220, p300, CTCF, and the H3K4me3 histone mark. Red indicates overlap with CTCF, green indicates overlap with other marks, and unfilled boxes represent no overlap. (B) Pie chart representing the percentage of ubiquitous DNaseI HS sites that overlap with various factors (histone modifications not shown for clarity purposes).
Figure 4
Figure 4. The CTCF Motif Is Identified in Ubiquitous Distal DNaseI HS Sites
(A) Motif identified using de novo motif-finding algorithm using the minimal intersecting regions of ubiquitous distal DNaseI HS sites. The overall height of the stack of letters in a position indicates the sequence conservation at that position, while the height of letters within the stack indicates the relative frequency of each base at that position. (B) Percentage of ubiquitous distal DNaseI HS sites that overlap with CTCF ChIP-chip data, CTCF motif, or other enhancer elements. (C) Example of clustered ubiquitous DNaseI HS sites that overlap CTCF in the H19/IGF2 locus. Arrows indicate ubiquitous DNaseI HS sites overlapping with CTCF. (D) Cell culture insulator assays demonstrate that DNaseI HS sites (that overlap CTCF) display enhancer-blocking activity. Higher colony counts in G418 media indicate no enhancer-blocking activity, while lower colony counts indicate positive enhancer-blocking activity. A previously described chicken insulator was used as a positive control [11].
Figure 5
Figure 5. Percentage of Distal Unique, Common, or Ubiquitous DNaseI HS Sites That Overlap with CTCF, p300, and TRAP220
CTCF binding makes up a greater percentage of more common and ubiquitous distal DNaseI HS sites, while p300 and TRAP220 binding makes up a greater percentage of cell type–specific and less-common DNaseI HS sites.
Figure 6
Figure 6. DNaseI HS Sites Colocalize with Histone Modifications, p300 Binding, and Gene Expression in a Cell Type–Specific Manner
The enrichment factors of proximal (A) or distal (B) DNaseI HS sites with H3K4me2 ChIP-chip hits from three different cell types. The enrichment factors of proximal (C) or distal (D) DNaseI HS sites with p300 ChIP-chip hits. (E) Cell type–specific DNaseI HS sites (y-axis) are mapped relative to transcription start sites of genes with cell type–specific expression (x-axis). Size of bubbles represents the enrichment. When no bubble is present, the value is zero (complete depletion).

References

    1. Lemon B, Tjian R. Orchestrated response: A symphony of transcription factors for gene control. Genes Dev. 2000;14:2551–2569. - PubMed
    1. Orphanides G, Reinberg D. A unified theory of gene expression. Cell. 2002;108:439–451. - PubMed
    1. Gross DS, Garrard WT. Nuclease hypersensitive sites in chromatin. Annu Rev Biochem. 1988;57:159–197. - PubMed
    1. Crawford GE, Davis S, Scacheri PC, Renaud G, Halawi MJ, et al. DNase-chip: A high-resolution method to identify DNase I hypersensitive sites using tiled microarrays. Nat Methods. 2006;3:503–509. - PMC - PubMed
    1. Orlando V. Mapping chromosomal proteins in vivo by formaldehyde-crosslinked-chromatin immunoprecipitation. Trends Biochem Sci. 2000;25:99–104. - PubMed

Publication types

MeSH terms