. 2007;8(8):R172.
doi: 10.1186/gb-2007-8-8-r172.

Quantitative genomics of locomotor behavior in Drosophila melanogaster

Affiliations

Quantitative genomics of locomotor behavior in Drosophila melanogaster

Katherine W Jordan et al. Genome Biol. 2007.

Abstract

Background: Locomotion is an integral component of most animal behaviors, and many human health problems are associated with locomotor deficits. Locomotor behavior is a complex trait, with population variation attributable to many interacting loci with small effects that are sensitive to environmental conditions. However, the genetic basis of this complex behavior is largely uncharacterized.

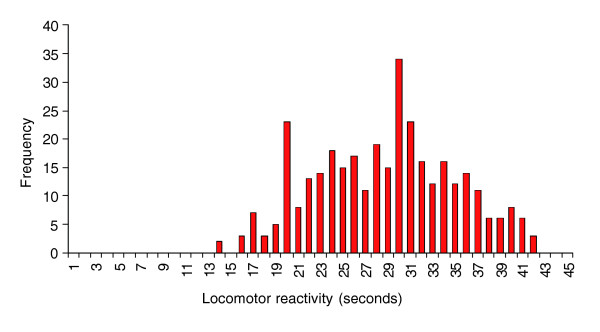
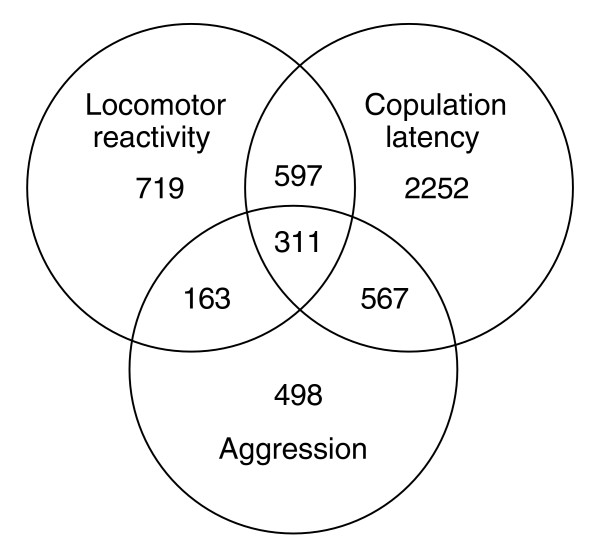
Results: We quantified locomotor behavior of Drosophila melanogaster in a large population of inbred lines derived from a single natural population, and derived replicated selection lines with different levels of locomotion. Estimates of broad-sense and narrow-sense heritabilities were 0.52 and 0.16, respectively, indicating substantial non-additive genetic variance for locomotor behavior. We used whole genome expression analysis to identify 1,790 probe sets with different expression levels between the selection lines when pooled across replicates, at a false discovery rate of 0.001. The transcriptional responses to selection for locomotor, aggressive and mating behavior from the same base population were highly overlapping, but the magnitude of the expression differences between selection lines for increased and decreased levels of behavior was uncorrelated. We assessed the locomotor behavior of ten mutations in candidate genes with altered transcript abundance between selection lines, and identified seven novel genes affecting this trait.

Conclusion: Expression profiling of genetically divergent lines is an effective strategy for identifying genes affecting complex behaviors, and reveals that a large number of pleiotropic genes exhibit correlated transcriptional responses to multiple behaviors.


Figures

Figure 1
Figure 1
Frequency distribution of locomotor reactivity scores (in seconds) among inbred lines derived from the Raleigh population.
Figure 2
Figure 2
Phenotypic response to selection for locomotor reactivity. (a) Mean activity scores of selection lines (in seconds). The blue dots represent the L lines, the yellow dots represent the C lines, and the red dots represent the H lines. Solid lines and filled circles, replicate 1; dashed lines and open circles, replicate 2. (b) Regressions of cumulative response on cumulative selection differential for divergence between H and L lines. The blue diamonds and blue line represent replicate 1, and the red squares and red line represent replicate 2.
Figure 3
Figure 3
Correlated phenotypic responses to selection. All scores are pooled across three successive generations. Lines with the same letter are not significantly different from one another at P < 0.05. H lines are red, C lines are yellow, L lines are blue. Solid lines and bars represent replicate 1, and dashed bars and lines denote replicate 2. The red asterisk denotes each line is significantly (P < 0.05) different from each other, and the black asterisk denotes H lines and C lines are not significantly different from each other, but are significantly different than L lines. (a) Starvation resistance, (b) chill coma recovery, (c) ethanol tolerance, (d) copulation latency, (e) behavioral locomotor senescence.
Figure 4
Figure 4
Frequency of relative fold-change of probe sets with significant changes in transcript abundance between H and L selection lines, pooled over sexes. The vertical dashed black lines demarcate two-fold changes in transcript abundance.
Figure 5
Figure 5
Mean locomotor reactivity scores (seconds) of lines containing P-element insertional mutations in candidate genes. The blue bar denotes the Canton S B co-isogenic control line; the red bars indicate the mutant lines. The red asterisk represents mutants that are significantly different from the control line with P values that exceed Bonferroni correction for multiple testing (P = 0.005), and the black asterisk represents mutants for which P < 0.05, but do not surpass the conservative Bonferroni correction.
Figure 6
Figure 6
Numbers of probe sets that were significantly (Q < 0.001) differentially expressed between replicate selection lines selected for locomotor reactivity, copulation latency, and aggressive behavior. All selection lines were derived from the same base population.
Figure 7
Figure 7
Correlations of the mean H - L difference in expression (x- and y-axes) for significant probe sets in common between two behaviors. Only probe sets that had significant contrast statements (P < 0.05, pooled across sexes) of H ≠ L for locomotion and aggression, and F ≠ S for copulation latency are represented. (a) Locomotor reactivity and aggression; (b) locomotor reactivity and copulation latency; (c) aggression and copulation latency.

References

    1. Jordan KW, Morgan TJ, Mackay TFC. Quantitative trait loci for locomotor behavior in Drosophila melanogaster. Genetics. 2006;174:271–284. doi: 10.1534/genetics.106.058099. - DOI - PMC - PubMed
    1. Mackay TFC. The genetic architecture of quantitative traits. Annu Rev Genet. 2001;35:303–339. doi: 10.1146/annurev.genet.35.102401.090633. - DOI - PubMed
    1. Adams MD, Celniker SE, Holt RA, Evans CA, Gocayne JD, Amanatides PG, Scherer SE, Li PW, Hoskins RA, Galle RF, et al. The genome sequence of Drosophila melanogaster. Science. 2000;287:2185–2195. doi: 10.1126/science.287.5461.2185. - DOI - PubMed
    1. Olanow CW, Tatton WG. Etiology and pathogenesis of Parkinson's disease. Annu Rev Neurosci. 1999;22:123–144. doi: 10.1146/annurev.neuro.22.1.123. - DOI - PubMed
    1. Chen Q, He Y, Yang K. Gene therapy for Parkinson's disease: progress and challenges. Curr Gene Therapy. 2005;5:71–80. - PubMed

Publication types