. 2007 Sep 3;204(9):2187-98.
doi: 10.1084/jem.20070489. Epub 2007 Aug 20.

Cross-competition of CD8+ T cells shapes the immunodominance hierarchy during boost vaccination

Affiliations

Cross-competition of CD8+ T cells shapes the immunodominance hierarchy during boost vaccination

Wolfgang Kastenmuller et al. J Exp Med. .

Abstract

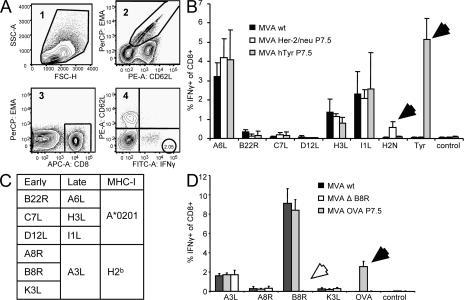
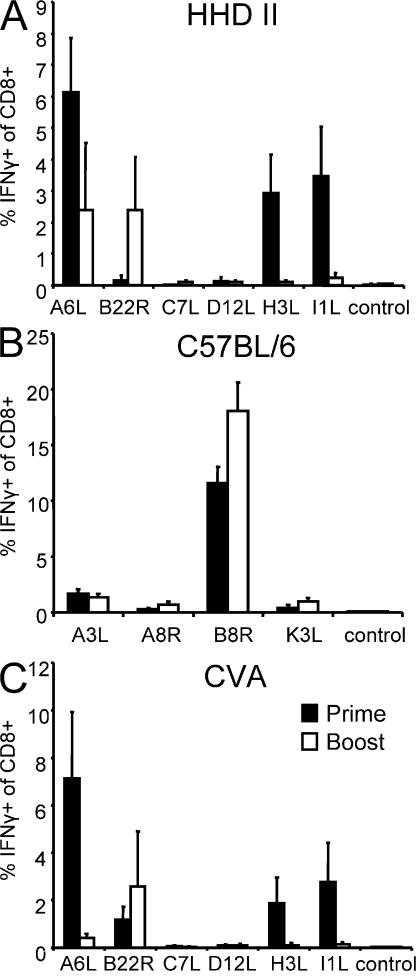
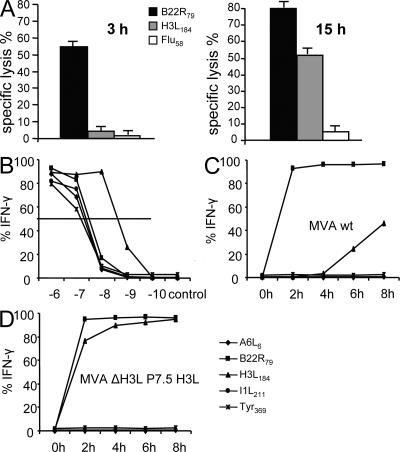
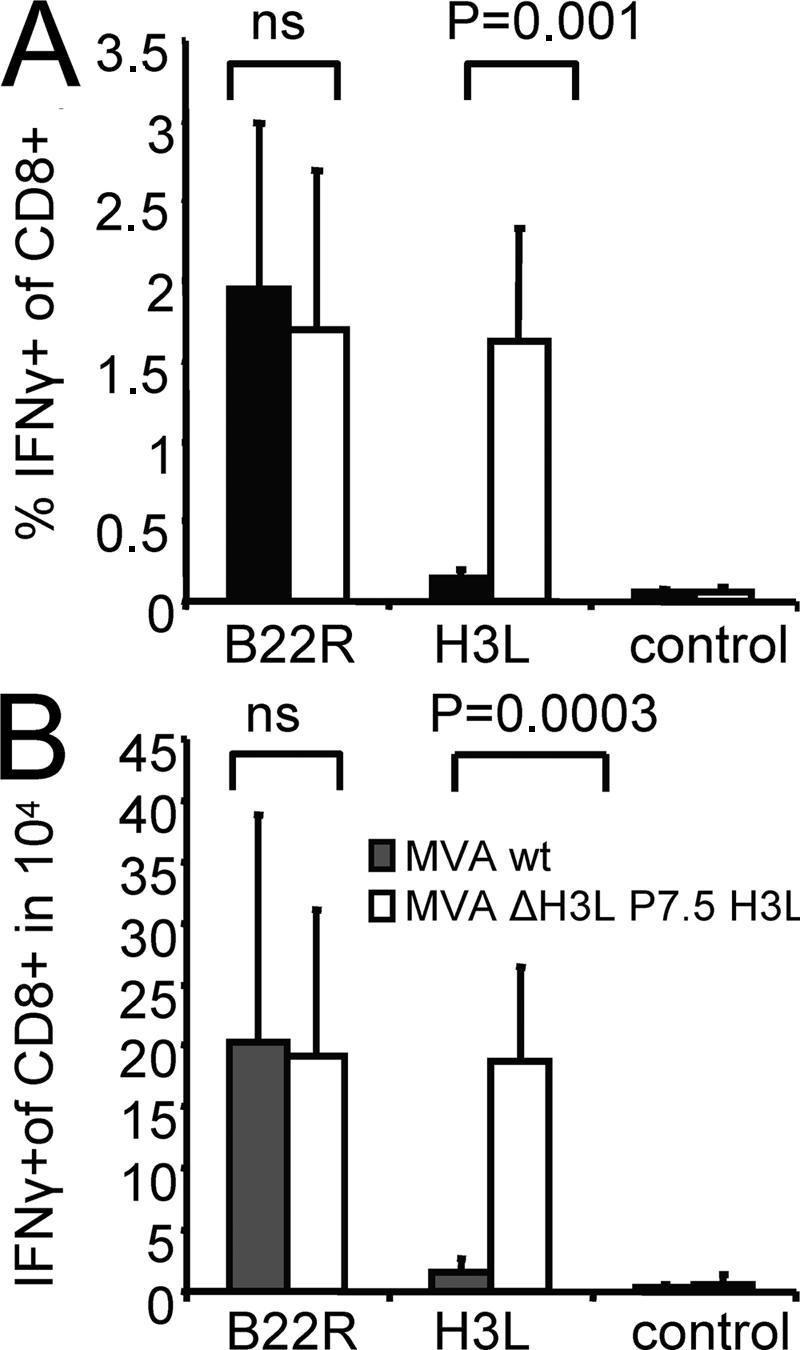
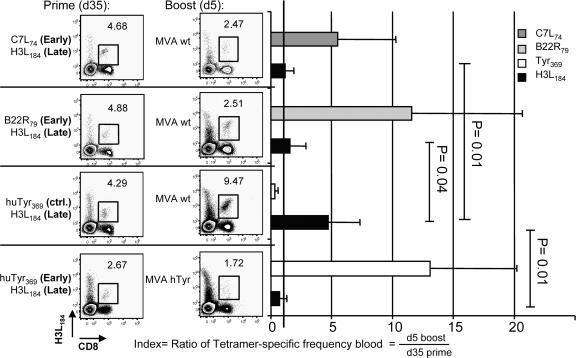
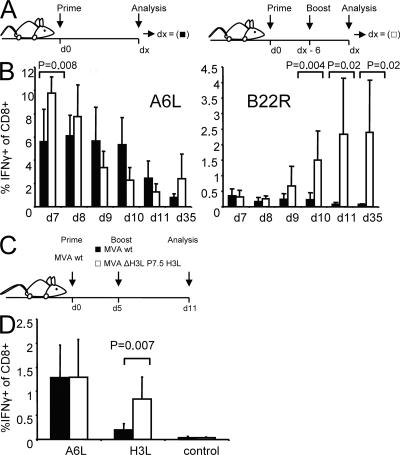
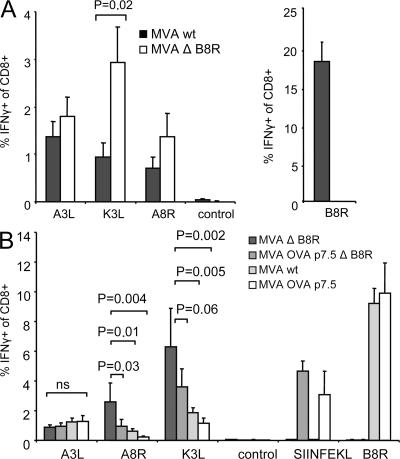
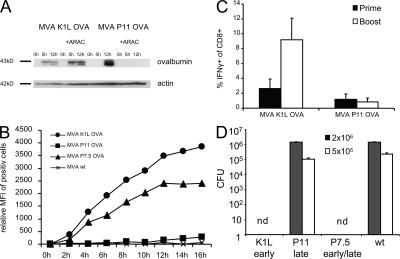
CD8+ T cell responses directed against multiple pathogen-derived epitopes are characterized by defined immunodominance hierarchy patterns. A possible explanation for this phenomenon is that CD8+ T cells of different specificities compete for access to epitopes on antigen-presenting cells, and that the outcome of this so-called cross-competition reflects the number of induced T cells. In our study using a vaccinia virus infection model, we found that T cell cross-competition is highly relevant during boost vaccination, thereby shaping the immunodominance hierarchy in the recall. We demonstrate that competition was of no importance during priming and was unaffected by the applied route of immunization. It strongly depended on the timing of viral antigen expression in infected APCs, and it was characterized by poor proliferation of T cells recognizing epitopes derived from late viral proteins. To our knowledge, this is the first demonstration of the functional importance of T cell cross-competition during a viral infection. Our findings provide a basis for novel strategies for how boost vaccination to defined antigens can be selectively improved. They give important new insights into the design of more efficient poxviral vectors for immunotherapy.


Figures

Figure 1.
Figure 1.
T cell cross-competition is absent during priming with MVA. (A) The applied gating strategy for analysis of viable (EMA-negative) CD8+- and CD62L-low IFN-γ–producing T cells (corresponding number is encircled). Numbers in the top left corner indicate the order of applied gates. (B) HHD mice were vaccinated i.p. (107 IU) with rec MVA or MVA WT. (C) Table shows early and late viral antigens and MHC-I restriction of the respective epitopes. (D) C57BL/6 mice were vaccinated i.p. (108 IU) with MVA WT, MVA P7.5 OVA, or MVA deletion mutant (MVA ΔB8R). 8 d after vaccination, tyrosinase-, her-2/neu–, OVA-, and vector-specific CD8+ T cell responses were analyzed by intracellular cytokine staining of splenocytes after a brief incubation with the A*0201-restricted tyrosinase peptide Tyr369, Her-2/neu435, MVA-specific peptides A6L6, B22R79, C7L74, D12L251, I1L211, H3L184, or H2b restricted OVA257 (SIINFEKL), MVA-specific peptides A3L270, A8R189, B8R20, K3L6, or an irrelevant peptide. Filled arrows indicate additional responses; open arrows represent missing responses compared with MVA WT. Results are representative of three independent experiments. n = 4.
Figure 2.
Figure 2.
Immunodominance hierarchy is changed after secondary immunization in HHD mice. (A) HHD or C57BL/6 mice were analyzed 8 d after prime (shaded bar) or boosted 35 d after prime and analyzed 6 d later (open bar). Mice were vaccinated i.p. with 108 IU. Only in HHD mice did B22R79-specific T cells increase in frequency; A6L6-, H3L184-, and I1L211-specific T cells do not proliferate during secondary immunizations. (B) In C57BL/6 mice, B8R20-specific T cells dominate the primary and secondary response. (C) Replication-competent virus CVA shows a shift similar to MVA in the immunodominance hierarchy. Results are representative of three independent experiments. n = 4.
Figure 3.
Figure 3.
Antigen presentation of late viral proteins is delayed. Specific 51Cr release of MVA WT–infected (MOI 10) A375 target cells is shown (E/T ratio = 10:1). (A) H3L184-specific T cells do not substantially lyse infected target cells before 15 h after infection. (B) Peptide titration shows similar affinity of T cell lines, except for H3L184-specific T cells showing a higher affinity. (C) Infected LCL (MOI 10) was used for a kinetic analysis to stimulate IFN-γ production in several V V-specific T cell lines. MVA WT–infected cells already stimulate B22R79-specific (early gene) T cells 2 h after infection. H3L184-specific (late gene) T cells get stimulated 6 h after infection. A6L6- and I1L211-specific T cells (both late) or control cell line are not stimulated by MVA WT–infected cells. (D) LCL infected by recombinant virus MVA ΔH3L P7.5 H3L expressing the H3L gene under an early/late promoter rapidly induce IFN-γ production in H3L184-specific T cells. Data are representative of three independent experiments.
Figure 4.
Figure 4.
MVA ΔH3L P7.5 H3L amplifies H3L-specific T cell responses. HHD mice were primed i.p. with 108 IU of MVA WT and boosted with MVA WT (shaded bar) or MVA ΔH3L P7.5 H3L (open bar). MVA ΔH3L P7.5 H3L induces a significant expansion of H3L184-specific IFN-γ–producing T cells compared with MVA WT, without altering the T cell response against B22R79. Relative (A) and absolute numbers (B) of IFN-γ–producing, H3L184-specific T cells measured in the spleen compared with MVA WT. Data are representative of three independent experiments. n = 4.
Figure 5.
Figure 5.
Cross-competition between T cells recognizing early and late determinants. HHD mice were simultaneously primed with pairs of peptides. 35 d after prime, the frequencies of respective tetramer-specific CD8+ T cells in the peripheral blood were determined. Mice were boosted i.p. with 108 IU of MVA WT or MVA hTyr. 5 d later, tetramer-specific CD8+ T cells were again measured in the blood. Numbers within dot plots indicate frequencies of H3L184-specific T cells before (left column) and after boosting (right column). Index shows relative increase of tetramer-specific T cells after boosting. Black line indicates that frequencies before and after boost are equal (index = 1). In contrast to control T cells (Tyr369), the presence of B22R79- or C7L74-specific T cells (both early genes) significantly suppresses the expansion of H3L184- (late gene) specific T cells after boosting with MVA WT. However, when MVA hTyr is used the expansion of H3L184-specific T cells is again suppressed, but Tyr369-specific T cells are readily amplified. Data are representative of three independent experiments. n = 5.
Figure 6.
Figure 6.
Competition between T cells occurs early after priming. HHD mice were primed with MVA WT and boosted with the same virus (A and B) early at indicated days after priming, or at day 5 with MVA ΔH3L P7.5 H3L (C and D). (A) Schematic of prime/boost regimen. (B) Intracellular cytokine staining of splenocytes, comparing the VV-specific CD8+ T cell responses after priming (shaded bar) or 6 d after boosting (open bar). B22R79-specific T cells are significantly increased when boosting 4 d after prime or later. (C) Schematic of prime/boost regimen. (D) H3L184-specific T cell responses can be significantly amplified when using MVA ΔH3L P7.5 H3L (open bar) as compared with MVA WT (closed bar). Data are summary of three independent experiments. n = 6.
Figure 7.
Figure 7.
Early virus-specific T cells suppress the expansion of early and late virus-specific T cells. (A) Intracellular cytokine staining of splenocytes comparing MVA ΔB8R (open bar) with MVA WT (shaded bar) 6 d after homologous boost (day 35). Immunodominance hierarchy is changing in MVA ΔB8R–immunized mice favoring the expansion of K3L6- and A8R189- (both early genes) specific T cells over A3L270- (late gene) specific T cells in the absence of B8R20-specific T cells. (B) Intracellular cytokine staining of splenocytes comparing MVA ΔB8R with MVA OVA P7.5 ΔB8R, MVA WT, and MVA OVA P7.5 6 d after homologous boost (day 5). The expansion of K3L6- and A8R189-specific (both early genes) T cells is successively suppressed by gradual appearance of cross-competing B8R20- and OVA257-specific (both early genes) T cells, wheras A3L270-specific (late gene) T cells remain fully suppressed. Data are representative of two independent experiments. n = 5.
Figure 8.
Figure 8.
Timing of viral antigen expression is essential during secondary responses. (A) Western blot analysis of Hela cells infected with MVA K1L OVA or MVA P11 OVA in the presence (+) or absence (-) of Ara-C, which is a specific inhibitor of late viral gene expression. Cell lysates were harvested at 0, 5, or 12 h after infection. (B) For relative quantification of SIINFEKL-Kb complexes on infected cells, 25-D1.16 antibody was used. Mean fluorescence intensity of positive cells is shown. (C) Intracellular cytokine staining of splenocytes comparing MVA K1L OVA with MVA P11 OVA 8 d (shaded bar) after prime or 6 d (open bar) after boost, which was performed 35 d after priming with MVA P7.5 OVA, to allow for comparable memory T cell frequencies at the time of the second immunization. Mice were primed and boosted i.p. 5 d later with different MVA constructs. (D) 6 d after homologous boost, mice were challenged with different doses of L. monocytogenes-OVA (2 × 106 = shaded bar; 5 × 105 = open bar) i.v. and numbers of viable L. monocytogenes in spleen were determined 2 d later. nd = not detectable.

References

    1. Yewdell, J.W., and J.R. Bennink. 1999. Immunodominance in major histocompatibility complex class I-restricted T lymphocyte responses. Annu. Rev. Immunol. 17:51–88. - PubMed
    1. Kedl, R.M., J.W. Kappler, and P. Marrack. 2003. Epitope dominance, competition and T cell affinity maturation. Curr. Opin. Immunol. 15:120–127. - PubMed
    1. Stock, A.T., C.M. Jones, W.R. Heath, and F.R. Carbone. 2006. CTL response compensation for the loss of an immunodominant class I-restricted HSV-1 determinant. Immunol. Cell Biol. 84:543–550. - PubMed
    1. Thomas, P.G., S.A. Brown, R. Keating, W. Yue, M.Y. Morris, J. So, R.J. Webby, and P.C. Doherty. 2007. Hidden epitopes emerge in secondary influenza virus-specific CD8+ T cell responses. J. Immunol. 178:3091–3098. - PubMed
    1. Probst, H.C., T. Dumrese, and M.F. van den Broek. 2002. Cutting edge: competition for APC by CTLs of different specificities is not functionally important during induction of antiviral responses. J. Immunol. 168:5387–5391. - PubMed

Publication types

MeSH terms