. 2007 Aug 27;178(5):749-55.
doi: 10.1083/jcb.200704110. Epub 2007 Aug 20.

OPA1 processing controls mitochondrial fusion and is regulated by mRNA splicing, membrane potential, and Yme1L

Affiliations

OPA1 processing controls mitochondrial fusion and is regulated by mRNA splicing, membrane potential, and Yme1L

Zhiyin Song et al. J Cell Biol. .

Abstract

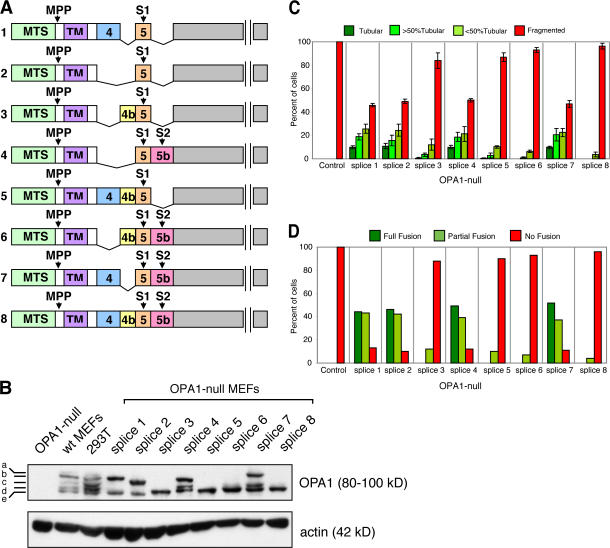
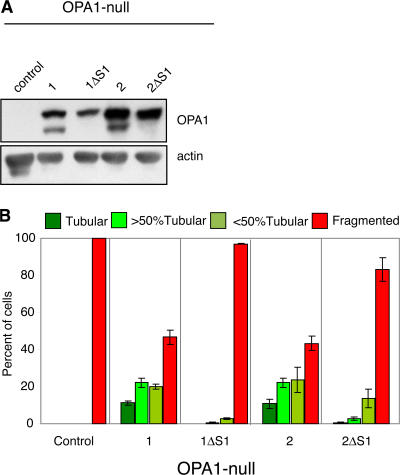
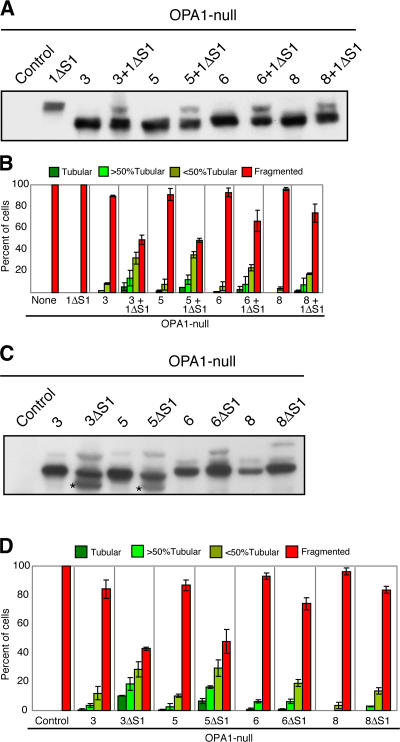
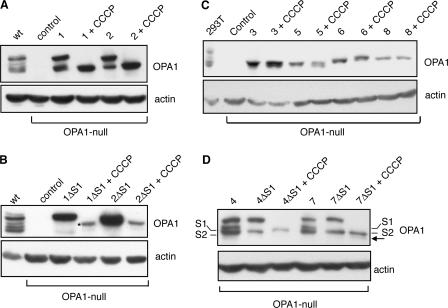
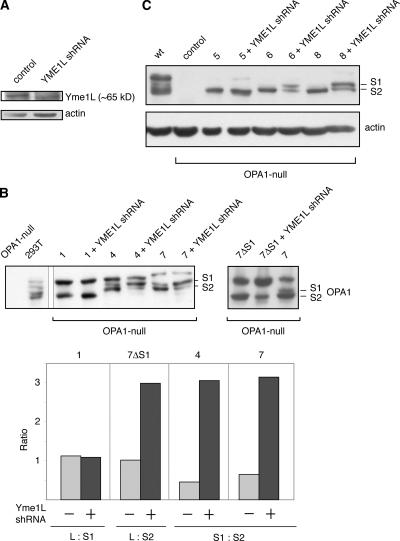
OPA1, a dynamin-related guanosine triphosphatase mutated in dominant optic atrophy, is required for the fusion of mitochondria. Proteolytic cleavage by the mitochondrial processing peptidase generates long isoforms from eight messenger RNA (mRNA) splice forms, whereas further cleavages at protease sites S1 and S2 generate short forms. Using OPA1-null cells, we developed a cellular system to study how individual OPA1 splice forms function in mitochondrial fusion. Only mRNA splice forms that generate a long isoform in addition to one or more short isoforms support substantial mitochondrial fusion activity. On their own, long and short OPA1 isoforms have little activity, but, when coexpressed, they functionally complement each other. Loss of mitochondrial membrane potential destabilizes the long isoforms and enhances the cleavage of OPA1 at S1 but not S2. Cleavage at S2 is regulated by the i-AAA protease Yme1L. Our results suggest that mammalian cells have multiple pathways to control mitochondrial fusion through regulation of the spectrum of OPA1 isoforms.


Figures

Figure 1.
Figure 1.
OPA1 mRNA splice forms that are partially processed have substantial mitochondrial fusion activity in isolation. (A) Schematic of the eight OPA1 mRNA splice forms. The mRNA splice forms differ in the presence or absence of exons 4, 4b, and 5b. Cleavage of the mitochondrial targeting sequence (MTS) by MPP leads to the long isoforms. Additional cleavage at sites S1 (exon 5) or S2 (exon 5b) leads to the short isoforms. TM, transmembrane. (B) Processing of polypeptides encoded by individual OPA1 mRNA splice forms. The eight OPA1 mRNA splice forms were expressed in OPA1-null MEFs, which contain no OPA1 protein. OPA1 was detected by Western blot analysis with an anti-OPA1 antibody. The five bands detected in wild-type cells are indicated. Actin was used as a loading control. (C) Tubulation of mitochondria in OPA1-null cells by individual OPA1 mRNA splice forms. The eight OPA1 mRNA splice forms were expressed in OPA1-null cells containing mitochondrially targeted DsRed, and mitochondrial morphology was scored according to the criteria detailed in Materials and methods. 100 cells were scored in each experiment; error bars indicate SD in three independent experiments. (D) Mitochondrial fusion activity of individual OPA1 mRNA splice forms. The eight OPA1 splice forms were expressed in OPA1-null cells, and mitochondrial fusion was scored in the PEG cell hybrid assay at 7 h after cell fusion.
Figure 2.
Figure 2.
The long forms of isoform 1 or isoform 2 lack substantial mitochondrial fusion activity. (A) Processing of mRNA splice forms 1 and 2 and their ΔS1 mutants. After expression in OPA1-null cells, Western blot analysis was used to detect OPA1. Actin was used as a loading control. (B) Tubulation of mitochondria in OPA1-null cells. After expression of the indicated splice forms in OPA1-null cells containing mitochondrially targeted DsRed, cells were scored as in Fig. 1 C; error bars indicate the SD from triplicate experiments.
Figure 3.
Figure 3.
A combination of long and short OPA1 isoforms increases mitochondrial fusion. (A) Coexpression of 1ΔS1 with short isoforms. The indicated constructs were expressed in OPA1-null cells and analyzed by Western blotting. (B) Functional complementation of 1ΔS1. OPA1-null cells were infected with retrovirus expressing splice forms 3, 5, 6, or 8. Each infected line along with an uninfected control was transfected with a control GFP vector or the GFP vector and OPA1-1ΔS1. (C) Processing of ΔS1 mutants. The indicated splice forms and mutants were expressed in OPA1-null cells. OPA1 was detected by Western blot analysis. Asterisks indicate novel cleavage products for 3ΔS1 and 5ΔS1. (D) Enhanced tubulation of mitochondria by ΔS1 mutants. The indicated OPA1 splice forms and mutants were expressed in OPA1-null cells. (B and D) Mitochondrial morphology was scored as in Fig. 1 C; error bars indicate the SD from triplicate experiments.
Figure 4.
Figure 4.
CCCP affects OPA1 processing and stability. (A) Effect of CCCP on isoforms 1 and 2. The splice forms 1 and 2 were expressed in OPA1-null cells and treated with CCCP as indicated. OPA1 was detected by Western blotting. Actin was used as a loading control. (B) Degradation of long forms of isoforms 1 and 2. Splice forms 1ΔS1 and 2ΔS1 were expressed in OPA1-null cells and treated with CCCP as indicated. The asterisk indicates a new cleavage product with CCCP treatment of 1ΔS1. (C) Resistance of short isoforms to degradation. OPA1 constructs were expressed in OPA1-null cells and treated with CCCP as indicated. (D) CCCP effect on site S1 versus S2. OPA1 splice forms and their mutants were expressed in OPA1-null cells and analyzed as in A. The S1- and S2-cleaved products for isoforms 4 and 7 are labeled. The arrow indicates a novel cleavage product with CCCP treatment.
Figure 5.
Figure 5.
Yme1L knockdown reduces cleavage at site S2. (A) Knockdown of Yme1L. Lysates from control cells and cells expressing shRNA against Yme1L were analyzed by Western blotting against Yme1L. Actin was used as a loading control. (B) Effect of Yme1L knockdown on the proteolytic processing of isoforms 1, 4, and 7. OPA1 splice forms and mutants were expressed in OPA1-null cells and treated with shRNA against Yme1L as indicated. OPA1 was detected by Western blotting. For isoforms 4 and 7, the S2-cleaved short isoform is the lowest band, as indicated. These results are quantitated by densitometry in the bottom panel. For splice form 1 and 7ΔS1, the ratio of the long isoform to the short isoform is presented. For splice forms 4 and 7, which produce S1- and S2-cleaved products, the ratio of the S1-cleaved band to the S2-cleaved band is presented. (C) Effect of Yme1L knockdown on the proteolytic processing of isoforms 5, 6, and 8. Samples were analyzed as in B. The S1- and S2-cleaved products of isoforms 6 and 8 are labeled.

References

    1. Alexander, C., M. Votruba, U.E. Pesch, D.L. Thiselton, S. Mayer, A. Moore, M. Rodriguez, U. Kellner, B. Leo-Kottler, G. Auburger, et al. 2000. OPA1, encoding a dynamin-related GTPase, is mutated in autosomal dominant optic atrophy linked to chromosome 3q28. Nat. Genet. 26:211–215. - PubMed
    1. Arnold, I., and T. Langer. 2002. Membrane protein degradation by AAA proteases in mitochondria. Biochim. Biophys. Acta. 1592:89–96. - PubMed
    1. Chan, D.C. 2006. Mitochondrial fusion and fission in mammals. Annu. Rev. Cell Dev. Biol. 22:79–99. - PubMed
    1. Chen, H., S.A. Detmer, A.J. Ewald, E.E. Griffin, S.E. Fraser, and D.C. Chan. 2003. Mitofusins Mfn1 and Mfn2 coordinately regulate mitochondrial fusion and are essential for embryonic development. J. Cell Biol. 160:189–200. - PMC - PubMed
    1. Chen, H., A. Chomyn, and D.C. Chan. 2005. Disruption of fusion results in mitochondrial heterogeneity and dysfunction. J. Biol. Chem. 280:26185–26192. - PubMed

Publication types