. 2007 Sep 1;179(5):3026-34.
doi: 10.4049/jimmunol.179.5.3026.

Severe depletion of mucosal CD4+ T cells in AIDS-free simian immunodeficiency virus-infected sooty mangabeys

Affiliations

Severe depletion of mucosal CD4+ T cells in AIDS-free simian immunodeficiency virus-infected sooty mangabeys

Shari N Gordon et al. J Immunol. .

Abstract

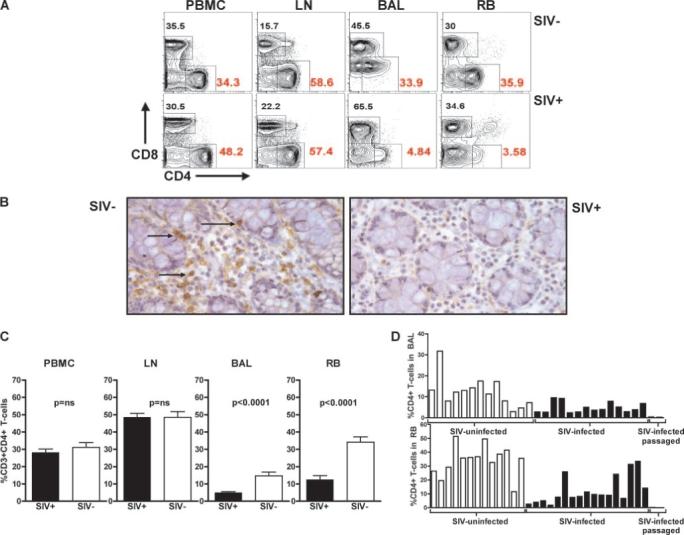
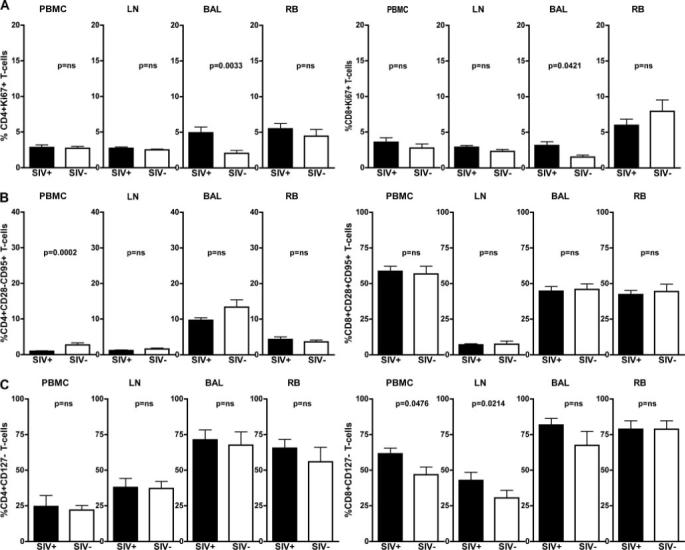
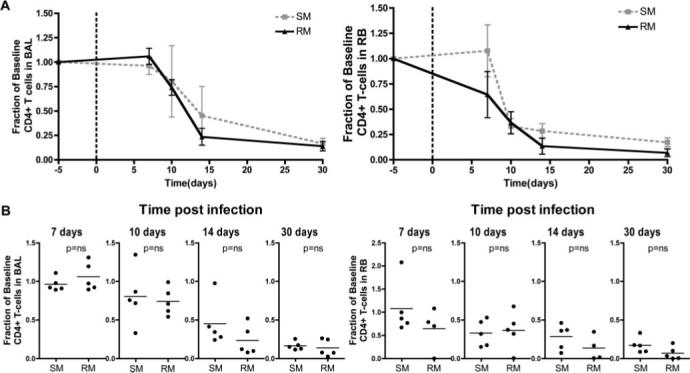
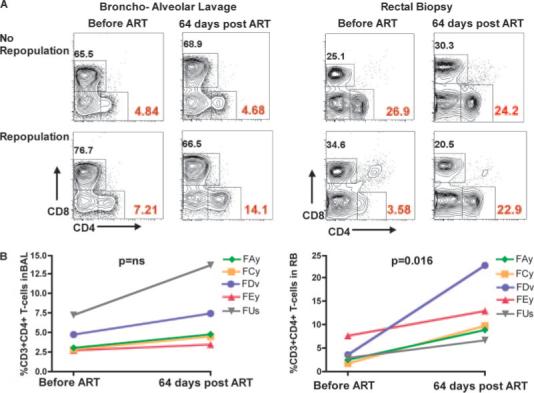
HIV-infected humans and SIV-infected rhesus macaques experience a rapid and dramatic loss of mucosal CD4+ T cells that is considered to be a key determinant of AIDS pathogenesis. In this study, we show that nonpathogenic SIV infection of sooty mangabeys (SMs), a natural host species for SIV, is also associated with an early, severe, and persistent depletion of memory CD4+ T cells from the intestinal and respiratory mucosa. Importantly, the kinetics of the loss of mucosal CD4+ T cells in SMs is similar to that of SIVmac239-infected rhesus macaques. Although the nonpathogenic SIV infection of SMs induces the same pattern of mucosal target cell depletion observed during pathogenic HIV/SIV infections, the depletion in SMs occurs in the context of limited local and systemic immune activation and can be reverted if virus replication is suppressed by antiretroviral treatment. These results indicate that a profound depletion of mucosal CD4+ T cells is not sufficient per se to induce loss of mucosal immunity and disease progression during a primate lentiviral infection. We propose that, in the disease-resistant SIV-infected SMs, evolutionary adaptation to both preserve immune function with fewer mucosal CD4+ T cells and attenuate the immune activation that follows acute viral infection protect these animals from progressing to AIDS.


Figures

FIGURE 1
FIGURE 1
Depletion of mucosal CD4+ T cell during nonpathogenic SIV infection of SMs. A, Representative flow cytometric contour plots showing the percentage of CD4+ and CD8+ T cells in the PB (PBMCs), LN, BAL, and RB of an uninfected (top panels) and an SIV-infected (bottom panels) SM. All contour plots are pregated on CD3+ T cells. B, Immunohistochemical stain for CD4 (brown, see arrows) in the rectal mucosa of a representative uninfected SM (left) and SIV-infected SM (right). C, Percentage of CD4+ T cells in the PBMCs, LN, BAL, and RB of 18 naturally SIV-infected (■) and 13 uninfected (□) SMs, as determined by flow cytometry. Values of p were determined by the Mann-Whitney U test. D, Percentage of CD4+ T cells in the BAL (top) and RB (bottom) in each of the 33 SMs included in this study. At the extreme right of the bar graphs are the data relative to two experimentally SIV-infected SMs that experienced generalized CD4+ T cell depletion in association with expanded cell tropism, but remained asymptomatic for >4 years. These latter two animals were inoculated with 1 ml of plasma passaged from a naturally SIV-infected SM with high virus replication.
FIGURE 2
FIGURE 2
Depletion of mucosal CD4+ T cells in SIV-infected SMs is not associated with increased mucosal or systemic immune activation. T cells isolated from blood (PBMCs), LN, BAL, and RB of 18 naturally SIV-infected (■) and 13 uninfected (□) SMs were assessed for their levels of immune activation and proliferation. A, Percentage of CD4+Ki67+ (top left) and CD8+Ki67+ (top right) as determined by flow cytometry; p values were determined by the Mann-Whitney U test. B, Percentage of effector (i.e., CD95+CD28) CD4+ (middle left) and CD8+ (middle right) T cells as determined by flow cytometry; p values were determined by the Mann-Whitney U test. C, Percentage of CD4+CD127 (bottom left) and CD8+CD127 (bottom right) as determined by flow cytometry; p values as determined by the Mann-Whitney U test.
FIGURE 3
FIGURE 3
Experimental SIV infection of SMs induces severe and persistent depletion of mucosal CD4+ T cells. A, Plasma viral load expressed as copies/ml plasma in five experimentally infected SMs designated FFs, FRs, FUv, FSs, and FWv (top left). B, Longitudinal analysis of the number of CD4+ T cells/mm3 PB in the animals shown in A (top right). C and D, Representative contour plots show the fraction of CD4+ and CD8+ T cells in the mucosa before and 14 and 30 days post-SIV infection all contour plots are pregated on CD3+ cells. Longitudinal analysis of the percentage of CD4+ T cells in BAL (C, bottom left) and RB (D, bottom right). The x-axis shows the time postinfection (days).
FIGURE 4
FIGURE 4
Kinetics of CD4+ T cell depletion during the acute phase of SIV infection of SMs and RMs. A, Fractional changes in CD4+ T cells relative to baseline in BAL and RB from experimentally SIVsmm-infected SMs and SIVmac239-infected RMs. B, Comparison of the fraction of baseline mucosal CD4+ T cells in SMs and RMs sampled at 7, 10, 14, and 30 days postinfection. Statistical analysis performed using the Mann-Whitney U test.
FIGURE 5
FIGURE 5
Antiretroviral therapy induces variable, but significant mucosal CD4+ T cell reconstitution in naturally SIV-infected SMs. A, Representative flow cytometric contour plots showing the percentage of CD4+ and CD8+ T cells in the BAL (left panels) and RB (right panels) of two naturally SIV-infected SMs before and at day 64 after initiation of antiretroviral therapy with PMPA and FTC. All contour plots are pregated on CD3+ T cells. The two animals were selected as representative of a minimal (top panels) or major (bottom panels) repopulation of MALT CD4+ T cells. B, Percentage of CD4+ T cells in the BAL (left) and RB (right) of five naturally SIV-infected SMs measured at baseline and at day 64 after initiation of antiretroviral therapy (ART) as determined by flow cytometry.
FIGURE 6
FIGURE 6
Transient systemic activation and microbial translocation during primary SIV infection of SMs. A and B, Longitudinal analysis of the percentage of circulating CD4+ (A, left) and CD8+ (B, right) T cells that express the proliferation marker Ki67 during primary SIV infection of SMs. The x-axis shows the time postinfection (days). C, Longitudinal analysis of the plasma levels of LPS in the same animals depicted in Fig. 3. The x-axis shows the time postinfection (days).

References

    1. Guadalupe M, Reay E, Sankaran S, Prindiville T, Flamm J, McNeil A, Dandekar S. Severe CD4+ T-cell depletion in gut lymphoid tissue during primary human immunodeficiency virus type 1 infection and substantial delay in restoration following highly active antiretroviral therapy. J. Virol. 2003;77:11708–11717. - PMC - PubMed
    1. Brenchley JM, Schacker TW, Ruff LE, Price DA, Taylor JH, Beilman GJ, Nguyen PL, Khoruts A, Larson M, Haase AT, Douek DC. CD4+ T cell depletion during all stages of HIV disease occurs predominantly in the gastrointestinal tract. J. Exp. Med. 2004;200:749–759. - PMC - PubMed
    1. Li Q, Duan L, Estes JD, Ma ZM, Rourke T, Wang Y, Reilly C, Carlis J, Miller CJ, Haase AT. Peak SIV replication in resting memory CD4+ T cells depletes gut lamina propria CD4+ T cells. Nature. 2005;434:1148–1152. - PubMed
    1. Mattapallil JJ, Douek DC, Hill B, Nishimura Y, Martin M, Roederer M. Massive infection and loss of memory CD4+ T cells in multiple tissues during acute SIV infection. Nature. 2005;434:1093–1097. - PubMed
    1. Mehandru S, Poles MA, Tenner-Racz K, Horowitz A, Hurley A, Hogan C, Boden D, Racz P, Markowitz M. Primary HIV-1 infection is associated with preferential depletion of CD4+ T lymphocytes from effector sites in the gastrointestinal tract. J. Exp. Med. 2004;200:761–770. - PMC - PubMed

Publication types

MeSH terms

Substances