. 2007 Aug 28;104(35):14122-7.
doi: 10.1073/pnas.0706711104. Epub 2007 Aug 20.

Characterization of the role of the Synaptotagmin family as calcium sensors in facilitation and asynchronous neurotransmitter release

Affiliations

Characterization of the role of the Synaptotagmin family as calcium sensors in facilitation and asynchronous neurotransmitter release

Sudipta Saraswati et al. Proc Natl Acad Sci U S A. .

Abstract

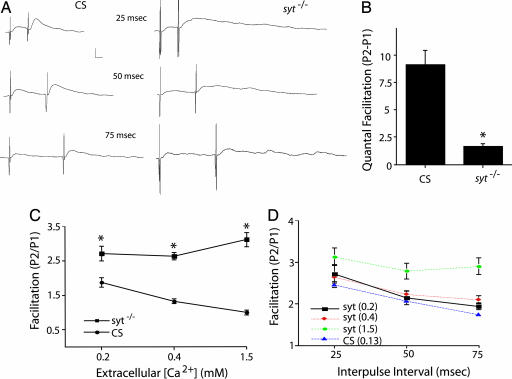
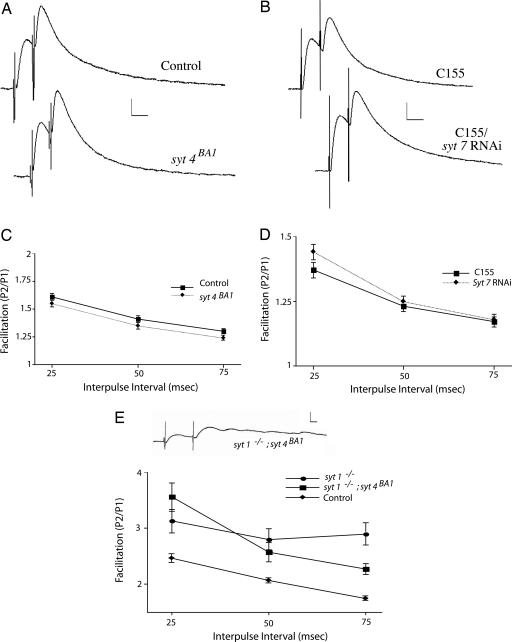
Ca(2+) influx into presynaptic nerve terminals activates synaptic vesicle exocytosis by triggering fast synchronous fusion and a slower asynchronous release pathway. In addition, a brief rise in Ca(2+) after consecutive action potentials has been correlated with a form of short-term synaptic plasticity with enhanced vesicle fusion termed facilitation. Although the synaptic vesicle protein Synaptotagmin 1 (Syt1) has been implicated as the Ca(2+) sensor for synchronous fusion, the molecular identity of the Ca(2+) sensors that mediate facilitation and asynchronous release is unknown. To test whether the synchronous Ca(2+) sensor, Syt1, or the asynchronous Ca(2+) sensor is involved in facilitation, we analyzed whether genetic elimination of Syt1 in Drosophila results in a concomitant impairment in facilitation. Our results indicate that Syt1 acts as a redundant Ca(2+) sensor for facilitation, with the asynchronous Ca(2+) sensor contributing significantly to this form of short-term plasticity. We next examined whether other members of the Drosophila Syt family functioned in Ca(2+)-dependent asynchronous release or facilitation in vivo. Genetic elimination of other panneuronally expressed Syt proteins did not alter these forms of exocytosis, indicating a non-Syt Ca(2+) sensor functions for both facilitation and asynchronous release. In light of these findings, the presence of two presynaptic Ca(2+) sensors can be placed in a biological context, a Syt1-based Ca(2+) sensor devoted primarily to baseline synaptic transmission and a second non-Syt Ca(2+) sensor for short-term synaptic plasticity and asynchronous release.


Conflict of interest statement

The authors declare no conflict of interest.

Figures

Fig. 1.
Fig. 1.
Syt1 plays a redundant role in paired-pulse facilitation. Intracellular recordings of paired-pulse facilitation from Drosophila third-instar larval NMJs at muscle 6 of wild-type Canton S (CS) and syt1null mutants. (A) Representative traces at 1.5 mM extracellular Ca2+ in sytAD4/sytN13 and at 0.13 mM extracellular Ca2+ in wild type. (Calibration bar: 5 mV/5 ms.) (B) Quantification of quantal facilitation as measured by the difference between the numbers of quanta released in two postsynaptic responses at 25-ms interpulse intervals and 0.2 mM extracellular Ca2+. The number of muscles examined and the average resting potentials (avg. RP) in millivolts ± SEM for each genotype were as follows: CS (n = 4; avg. RP = −62.88 ± 3.68) and syt1 (n = 6; avg. RP = −59 ± 2.24). Data points are mean ± SEM; statistical significance (*, P < 0.05) was determined by Student's t test. (C) Quantification of facilitation, as measured by the ratio between two postsynaptic responses, at 25-ms interpulse intervals in control and syt1null mutants at 0.2, 0.4, and 1.5 mM extracellular Ca2+. Data points are mean ± SEM; statistical significance (*, P < 0.05) was determined by Student's t test. The numbers of muscles examined for each genotype were as follows: CS (0.2 mM Ca2+, 6; 0.4 mM Ca2+, 15; and 1.5 mM Ca2+, 8) and syt1 (0.2 mM Ca2+, 9; 0.4 mM Ca2+, 27; and 1.5 mM Ca2+, 17). Average muscle resting membrane potentials for each genotype were as follows: CS (0.2 mM Ca2+, 54.58 ± 1.34; 0.4 mM Ca2+, 59.48 ± 0.61; and 1.5 mM Ca2+, 62.38 ± 1.23) and syt1 (0.2 mM Ca2+, 56.83 ± 1.74; 0.4 mM Ca2+, 56.74 ± 0.69; and 1.5 mM Ca2+, 61.19 ± 1.37). (D) Quantification of facilitation, as measured by the ratio between two postsynaptic responses, at 25-, 50-, and 75-ms interpulse intervals in control at 0.13 mM extracellular Ca2+ and in syt1null mutant animals at 0.2, 0.4, and 1.5 mM extracellular Ca2+. The numbers of muscles examined for each genotype were as follows: CS (25 ms, 19; 50 ms, 19; and 75 ms, 18), syt1 at 0.2 mM Ca2+ (25 ms, 9; 50 ms, 7; and 75 ms, 8), syt1 at 0.4 mM Ca2+ (25 ms, 27; 50 ms, 24; and 75 ms, 22), and syt1 at 1.5 mM Ca2+ (25 ms, 17; 50 ms, 14; and 75 ms, 11). Average muscle resting membrane potentials for each genotype were as follows: CS (25 ms, 56.08 ± 0.54; 50 ms, 55.77 ± 0.53; and 75 ms, 56 ± 0.63), syt1 at 0.2 mM Ca2+ (25 ms, 56.83 ± 1.74; 50 ms, 57.18 ± 2.62; 75 ms, 57.75 ± 2.76), syt1 at 0.4 mM Ca2+ (25 ms, 56.74 ± 0.69; 50 ms, 56.46 ± 0.79; and 75 ms, 57.31 ± 0.81), and syt1 at 1.5 mM Ca2+ (25 ms, 61.19 ± 1.37; 50 ms, 60.71 ± 1.59; 75 ms, 58.56 ± 1.68).
Fig. 2.
Fig. 2.
Generation of animals lacking Syt4. (A) Western blot of adult head extracts from control (precise excision) and syt4BA1 mutants. One fly-head equivalent of protein was loaded into each lane and blotted by using the α-Syt4 polyclonal antibody. Although several nonspecific bands remain and serve as loading controls, the syt4BA1 head extract is missing the abundant band corresponding to the predicted molecular weight of Syt4. (B) Immunostaining for Syt4 at larval brains (Upper) and at muscles 6 and 7 of the third-instar larval NMJ (Lower) in control and syt4BA1 mutants. Control and mutants were imaged by using identical confocal settings.
Fig. 3.
Fig. 3.
Generation of animals lacking Syt7. (A) Syt7 knockdown construct. The initial genomic region of the syt7 locus, including exons and introns 1 and 2, was fused to the reverse cDNA coding for exons 1 and 2, maintaining the splice acceptor and donor sites in the two introns. (B) (Lower) The third-instar larval muscles from white and Mhc-Gal4;syt7 RNAi larvae stained with the α-Syt7 polyclonal antibody. (Upper) Muscle-specific expression of a syt7–CFP transgene with or without coexpression of the syt7 RNAi transgene. Larvae coexpressing the two transgenes have dramatically reduced Syt7–CFP levels in muscles compared with control siblings.
Fig. 4.
Fig. 4.
Evoked neurotransmitter release in animals lacking Syt4 and Syt7. (A) Representative traces of evoked EJP at 0.4 mM extracellular Ca2+ in control and syt4BA1 mutants, as well as control (C155) and C155; syt7 RNAi knockdown animals. (B) Representative traces of evoked EJP at 0.1 mM extracellular Ca2+ in control and syt4BA1 mutants, as well as control (C155) and C155; syt7 RNAi knockdown animals. (C) Quantification of evoked EJP amplitudes in control and syt4null mutants, as well as control (c155) and C155; syt7 RNAi knockdown animals at 0.1, 0.2, and 0.4 mM extracellular Ca2+. Data points are mean ± SEM. The numbers of muscles examined and the average resting potential (avg. RP) in millivolts ± SEM for each genotype were as follows: control (0.1 mM Ca2+, n = 10, avg. RP = −64 ± 1.27; 0.2 mM Ca2+, n = 14, avg. RP = −60.3 ± 1.18; 0.4 mM Ca2+, n = 9, avg. RP = −69 ± 2), syt4null (0.1 mM Ca2+, n = 9, avg. RP = −68 ± 2.33; 0.2 mM Ca2+, n = 18, avg. RP = −59.43 ± 0.92; 0.4 mM Ca2+, n = 9, avg. RP = −66 ± 1.67), C155 (0.1 mM Ca2+, n = 8, avg. RP = −62 ± 2.12; 0.2 mM Ca2+, n = 30, avg. RP = −59 ± 0.7; 0.4 mM Ca2+, n = 9, avg. RP = −75 ± 2), and C155; syt7 RNAi (0.1 mM Ca2+, n = 8, avg. RP = −62 ± 1.41; 0.2 mM Ca2+, n = 26, avg. RP = −59.02 ± 0.82; 0.4 mM Ca2+, n = 9, avg. RP = −73 ± 1).
Fig. 5.
Fig. 5.
Paired-pulse facilitation remains intact in syt4null mutants, syt7 RNAi knockdown animals, and syt1;syt4 double mutants. (A) Representative traces of facilitation at 0.2 mM extracellular Ca2+ in syt4BA1 mutants and control animals. (Calibration bar: 5 mV/20 ms; interpulse interval: 25 ms.) (B) Representative traces of facilitation at 0.2 mM extracellular Ca2+ in C155; syt7 RNAi knockdown and control (C155) animals. (Calibration bar: 5 mV/20 ms; interpulse interval: 25 ms.) (C) Quantification of facilitation at 25-, 50-, and 75-ms interpulse intervals in control and syt4null mutant animals at 0.2 mM extracellular Ca2+. The numbers of muscles examined and the average resting potential (avg. RP) in millivolts ± SEM for each genotype were as follows: control (25 ms, n = 12, avg. RP = −59.84 ± 1.31; 50 ms, n = 12, avg. RP = −58.54 ± 1.56; and 75 ms, n = 12, avg. RP = −59.46 ± 1.46) and syt4null (25 ms, n = 16, avg. RP = −59.88 ± 0.83; 50 ms, n = 16, avg. RP = −60.08 ± 0.86; and 75 ms, n = 15, avg. RP = −59.3 ± 0.8). (D) Quantification of facilitation at 25-, 50-, and 75-ms interpulse intervals in control (C155) and in C155; syt7 RNAi knockdown animals at 0.2 mM extracellular Ca2+. The number of muscles examined and the avg. RP for each genotype were as follows: control (25 ms, n = 26, avg. RP = −58.49 ± 0.65; 50 ms, n = 25, avg. RP = −58.07 ± 0.69; and 75 ms, n = 24, avg. RP = −58.41 ± 0.76) and C155; syt7 RNAi (25 ms, n = 20, avg. RP = −59.01 ± 0.96; 50 ms, n = 24, avg. RP = −59.34 ± 0.85; and 75 ms, n = 24, avg. RP = −59.3 ± 0.83). (E) A representative trace from syt1; syt4 double mutants in 1.5 mM extracellular Ca2+. (Calibration bar: 5 mV/5 ms.) Quantification of facilitation at 25-, 50-, and 75-ms interpulse intervals in control (CS) at 0.13 mM extracellular Ca2+ and in syt1; syt4 double mutants at 1.5 mM extracellular Ca2+ is shown. For comparison, facilitation in the syt1-null mutant alone at 1.5 mM extracellular Ca2+ is shown. The number of muscles examined and avg. RP for each genotype were as follows: CS (25 ms, n = 19, avg. RP = −56.08 ± 0.54; 50 ms, n = 19, avg. RP = −55.77 ± 0.53; and 75 ms, n = 18, avg. RP = −56 ± 0.63) and syt1; syt4 (25 ms, n = 11, avg. RP = −60.98 ± 1.15; 50 ms, n = 11, avg. RP = −60.32 ± 0.97; and 75 ms, n = 10, avg. RP = −59.7 ± 1.16).

Similar articles

Cited by

References

    1. Katz B. The Release of Neural Transmitter Substances. Liverpool: Liverpool Univ Press; 1969.
    1. Goda Y, Stevens CF. Proc Natl Acad Sci USA. 1994;1994:12942–12946. - PMC - PubMed
    1. Augustine GJ, Eckert R. J Physiol (London) 1984;346:257–271. - PMC - PubMed
    1. Xu-Friedman MA, Regehr WG. J Neurosci. 2000;20:4414–4422. - PMC - PubMed
    1. Geppert M, Goda Y, Hammer RE, Li C, Rosahl TW, Stevens CF, Sudhof TC. Cell. 1994;79:717–727. - PubMed

Publication types

MeSH terms

LinkOut - more resources