. 2007 Aug 15;2(8):e743.
doi: 10.1371/journal.pone.0000743.

Predicting prokaryotic ecological niches using genome sequence analysis

Affiliations

Predicting prokaryotic ecological niches using genome sequence analysis

Garret Suen et al. PLoS One. .

Abstract

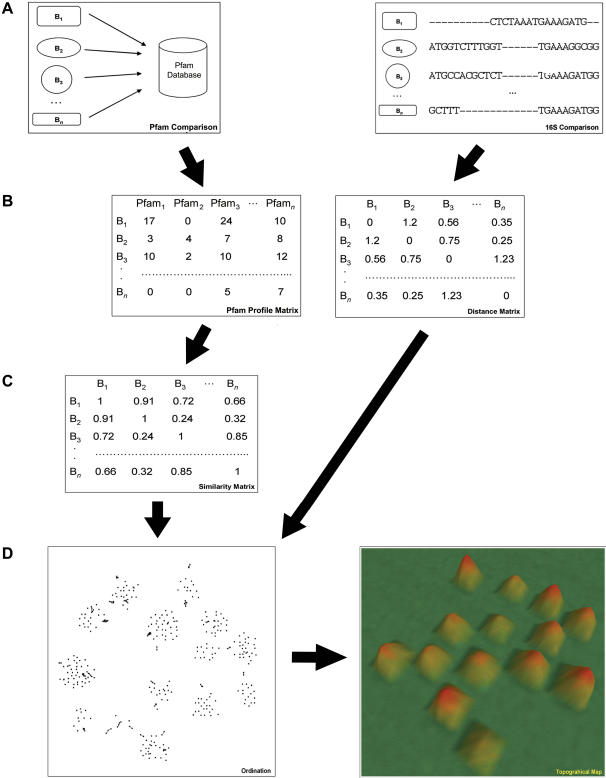
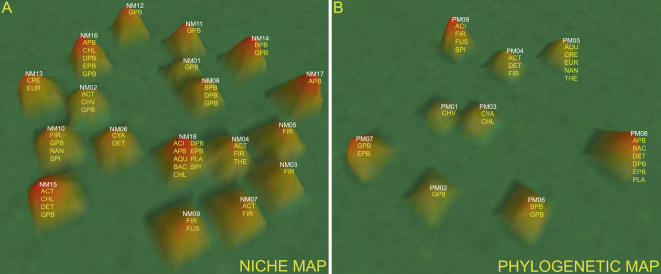
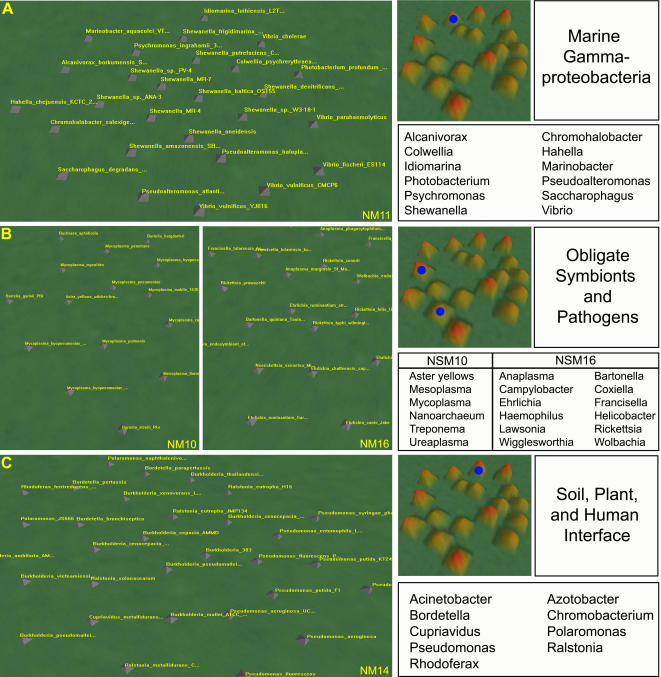
Automated DNA sequencing technology is so rapid that analysis has become the rate-limiting step. Hundreds of prokaryotic genome sequences are publicly available, with new genomes uploaded at the rate of approximately 20 per month. As a result, this growing body of genome sequences will include microorganisms not previously identified, isolated, or observed. We hypothesize that evolutionary pressure exerted by an ecological niche selects for a similar genetic repertoire in those prokaryotes that occupy the same niche, and that this is due to both vertical and horizontal transmission. To test this, we have developed a novel method to classify prokaryotes, by calculating their Pfam protein domain distributions and clustering them with all other sequenced prokaryotic species. Clusters of organisms are visualized in two dimensions as 'mountains' on a topological map. When compared to a phylogenetic map constructed using 16S rRNA, this map more accurately clusters prokaryotes according to functional and environmental attributes. We demonstrate the ability of this map, which we term a "niche map", to cluster according to ecological niche both quantitatively and qualitatively, and propose that this method be used to associate uncharacterized prokaryotes with their ecological niche as a means of predicting their functional role directly from their genome sequence.


Conflict of interest statement

Competing Interests: The authors have declared that no competing interests exist.

Figures

Figure 1
Figure 1. Construction of the niche and phylogenetic maps.
The niche map is constructed by comparing all predicted proteins within each prokaryote (B1–Bn) against the Pfam database (a). Likewise, construction of a phylogenetic map is done by performing a multiple sequence alignment using the 16S rRNA sequence from each prokaryote. Each metric is then converted into a Pfam profile and 16S distance matrix, respectively (b). The Pfam profile matrix is further converted into a similarity matrix by applying Spearman's rank correlation (c). Each Prokaryote is then assigned an (x, y) coordinate by applying a combination of multi-dimensional scaling and force-directed placement to both similarity and distance matrices as shown in (d). Finally, a topographical map is generated using the computer program VxInsight.
Figure 2
Figure 2. Topographical representation of the niche (a) and phylogenetic (b) maps.
Mountain numbers and the corresponding taxonomic groups for each prokaryote within each mountain are shown. Taxonomic abbreviations are as follows: ACI = Acidobacteria; ACT = Actinobacteria; APB = Alphaproteobacteria; AQU = Aquificae; BAC = Bacteroidetes/Chlorobi; BPB = Betaproteobacteria; DPB = Deltaproteobacteria; CHV = Chlamydiae/Verrucomicrobia; CHL = Chloroflexi; CRE = Crenarchaeota; CYA = Cyanobacteria; DET = Deinococcus-Thermus; EPB = Epsilonproteobacteria; EUR = Euryarchaeota; FIR = Firmicutes; FUS = Fusobacteria; GPB = Gammaproteobacteria; NAN = Nanoarchaeota; PLA = Planctomycetes; SPI = Spirochaetes; THE = Thermotogae.
Figure 3
Figure 3. Percentage of comparisons with matches for each prokaryote based on a shared taxonomic group metric.
The top 5, 10, 15, 20, and 25 nearest neighbors for each prokaryotic species were retained and their taxonomic groups compared by computing the average number of matches. This analysis was performed for prokaryotes on the niche map (circles) and the phylogenetic map (squares) as shown. In all cases, sequencing bias was taken into account by disregarding all pairs of prokaryotic species that had a Jaccard coefficient greater than 0.90 based on Pfam profile analysis (see Materials and Methods). A control (average of 10 trials) was also performed by randomizing the nearest neighbors for each prokaryotic species (hashes). Error bars for the randomized control are too small to be displayed.
Figure 4
Figure 4. Percentage of comparisons with matches for each prokaryotic species based on an environment and function metric.
The top 5, 10, 15, 20, and 25 nearest neighbors for each prokaryotic species were retained and their corresponding environmental and functional data were compared by computing the average number of matches across nine categories. This analysis was performed for prokaryotes on the niche map (circles) and the phylogenetic map (squares) as shown. In all cases, sequencing bias was taken into account by disregarding all pairs of prokaryotic species that had a Jaccard coefficient greater than 0.90 based on Pfam profile analysis (see Materials and Methods). A control (average of 10 trials) was also performed by randomizing the nearest neighbors for each prokaryotic species (hashes). Error bars for all three analyses are too small to be displayed.
Figure 5
Figure 5. Clustering of prokaryotic species on the niche map.
Three groups of prokaryotic species are shown, including the marine Gammaproteobacteria in NM11 that cluster according to phylogeny (a); the obligate symbionts and pathogens in NM10 and NM16 that cluster according to function (b); and the prokaryotes existing at the soil, plant, and human interface in NM14 that cluster according to environment. A high resolution view of each mountain is shown, in addition to the complete niche map labeled with the corresponding mountain (blue circles). The genus of every prokaryote in each mountain is also shown.

Similar articles

Cited by

References

    1. Riesenfeld CS, Schloss PD, Handelsman J. Metagenomics: genomic analysis of microbial communities. Annu Rev Genet. 2004;38:525–552. - PubMed
    1. Chen K, Pachter L. Bioinformatics for whole-genome shotgun sequencing of microbial communities. PLoS Comput Biol. 2005;1:106–112. - PMC - PubMed
    1. Cohan FM. Concepts of bacterial biodiversity for the age of genomics. In: Fraser CM, Read T, Nelson KE, editors. Microbial Genomes. Totowa, NJ: Humana Press; 2004.
    1. Goldenfeld N, Woese C. Biology's next revolution. Nature. 2007;445:369. - PubMed
    1. Martiny JB, Field D. Ecological perspectives on the sequenced genome collection. Ecology Letters. 2005;8:1334–1345.

Substances